


Derailment Prevention through Track Geometry Measurement
Introduction Railway safety is paramount, and derailment prevention is a critical aspect. XMPro's solution leverages advanced track geometry measurement to ensure track integrity, significantly reducing the risk of derailments. The Challenge The Challenge Rail operators face several challenges in maintaining track safety: Early Detection of Track Anomalies: Identifying subtle changes in track geometry that could
Introduction
Railway safety is paramount, and derailment prevention is a critical aspect. XMPro’s solution leverages advanced track geometry measurement to ensure track integrity, significantly reducing the risk of derailments.

The Challenge
The Challenge
Rail operators face several challenges in maintaining track safety:
- Early Detection of Track Anomalies: Identifying subtle changes in track geometry that could lead to derailments.
- Efficient Maintenance Scheduling: Optimizing track maintenance schedules to address issues without causing significant operational disruptions.
- Data Integration and Analysis: Effectively integrating and analyzing vast amounts of track measurement data to make informed decisions.
The Solution: XMPro iBOS for Track Geometry Measurement For Derailment Prevention
XMPro’s solution for derailment prevention employs advanced sensors and analytics for precise track geometry measurement, enabling proactive derailment prevention strategies. It utilizes existing state-of-the-art sensors to continuously monitor track geometry, including parameters like gauge, alignment, elevation, and curvature. XMPro’s Data Stream Designer integrates sensor data, applying machine learning algorithms to predict potential track issues before they escalate into derailment risks. The system provides real-time monitoring of track conditions, with an alert system that notifies maintenance teams of any detected anomalies requiring immediate attention. Predictive insights are used to optimize maintenance schedules, focusing on condition-based interventions rather than fixed-interval maintenance. Customizable dashboards present key track geometry data, alongside comprehensive reporting features for maintenance planning and regulatory compliance.
Key Features
Key Features
- Utilize Existing Advanced Track Geometry Sensors:Utilizing existing state-of-the-art sensors to continuously monitor track geometry, including parameters like gauge, alignment, elevation, and curvature.
- Data Integration and Predictive Analytics:XMPro’s Data Stream Designer integrates sensor data, applying machine learning algorithms to predict potential track issues before they escalate into derailment risks.
- Real-Time Monitoring and Alerts:Providing real-time monitoring of track conditions, with an alert system that notifies maintenance teams of any detected anomalies requiring immediate attention.
- Maintenance Optimization:Using predictive insights to optimize maintenance schedules, focusing on condition-based interventions rather than fixed-interval maintenance.
- Customizable Dashboards and Reporting:Offering customizable dashboards that present key track geometry data, alongside comprehensive reporting features for maintenance planning and regulatory compliance.
How XMPro iBOS Modules Work Together To Create This Flood Prediction Solution
Integration & Transformation
Intelligence & Decision Making
Visualization & Event Response

Artificial Intelligence &
Generative Agents

XMPro Data Stream Designer
XMPRO’s Data Stream Designer lets you visually design the data flow and orchestration for your real-time applications. Our drag & drop connectors make it easy to bring in real-time data from a variety of sources, add contextual data from systems like EAM, apply native and third-party analytics and initiate actions based on events in your data.
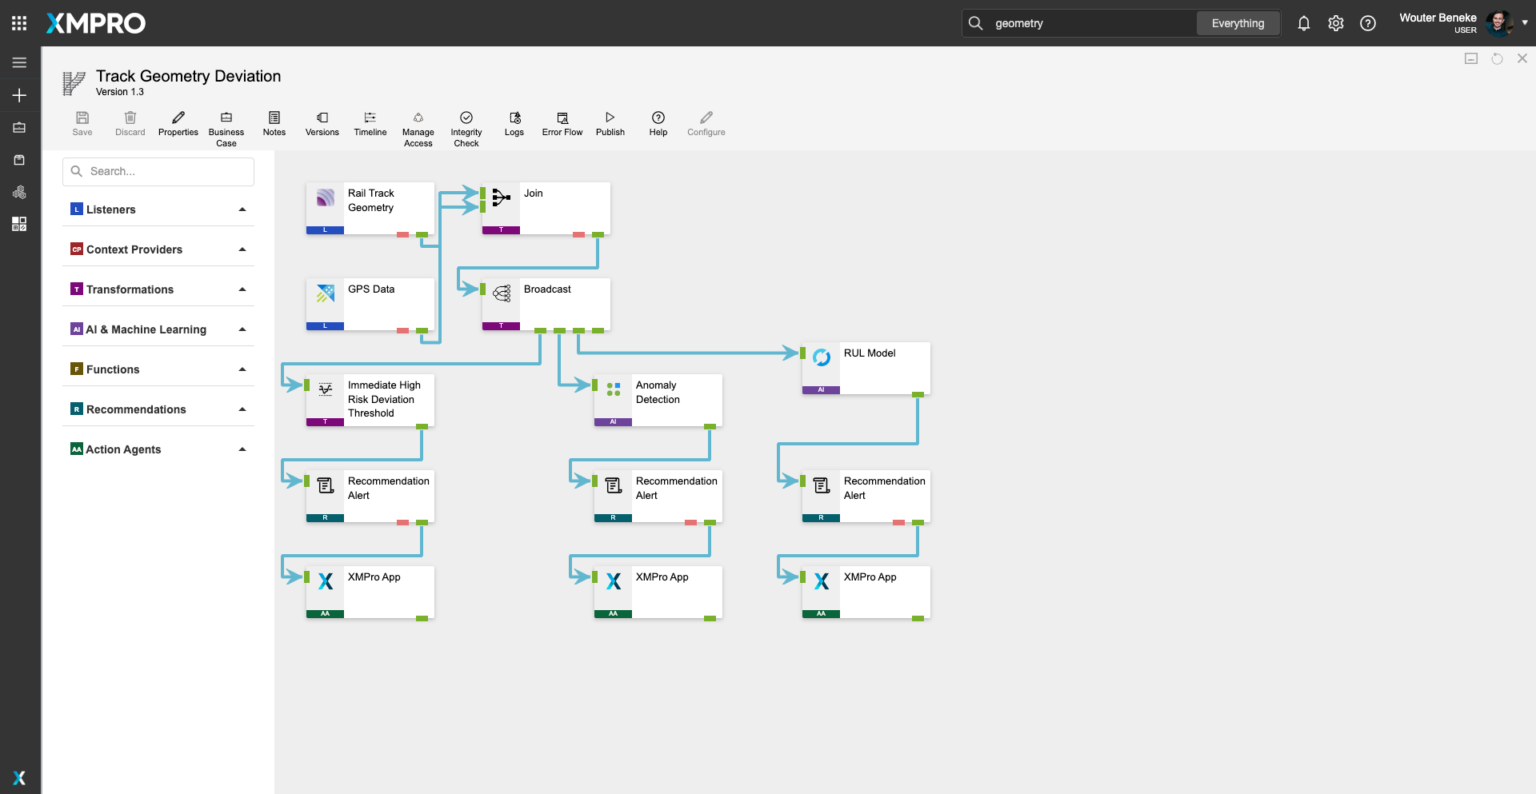
Figure 1: Track Geometry Deviation Data Stream
This track geometry deviation data stream ingests real-time data from rail track geometry sensors and GPS data from trains to prevent derailments. The data is processed through combining geometry and GPS data, then broadcasted for further analysis. Immediate high-risk deviations are flagged using predefined thresholds, and alerts are generated to notify maintenance teams. An anomaly detection model further analyzes the data for subtle issues, while a Remaining Useful Life (RUL) model predicts track section longevity. The data stream generates additional recommendation alerts based on these analyses. All alerts and recommendations are displayed in the XMPro App, providing actionable insights for timely maintenance and derailment prevention.
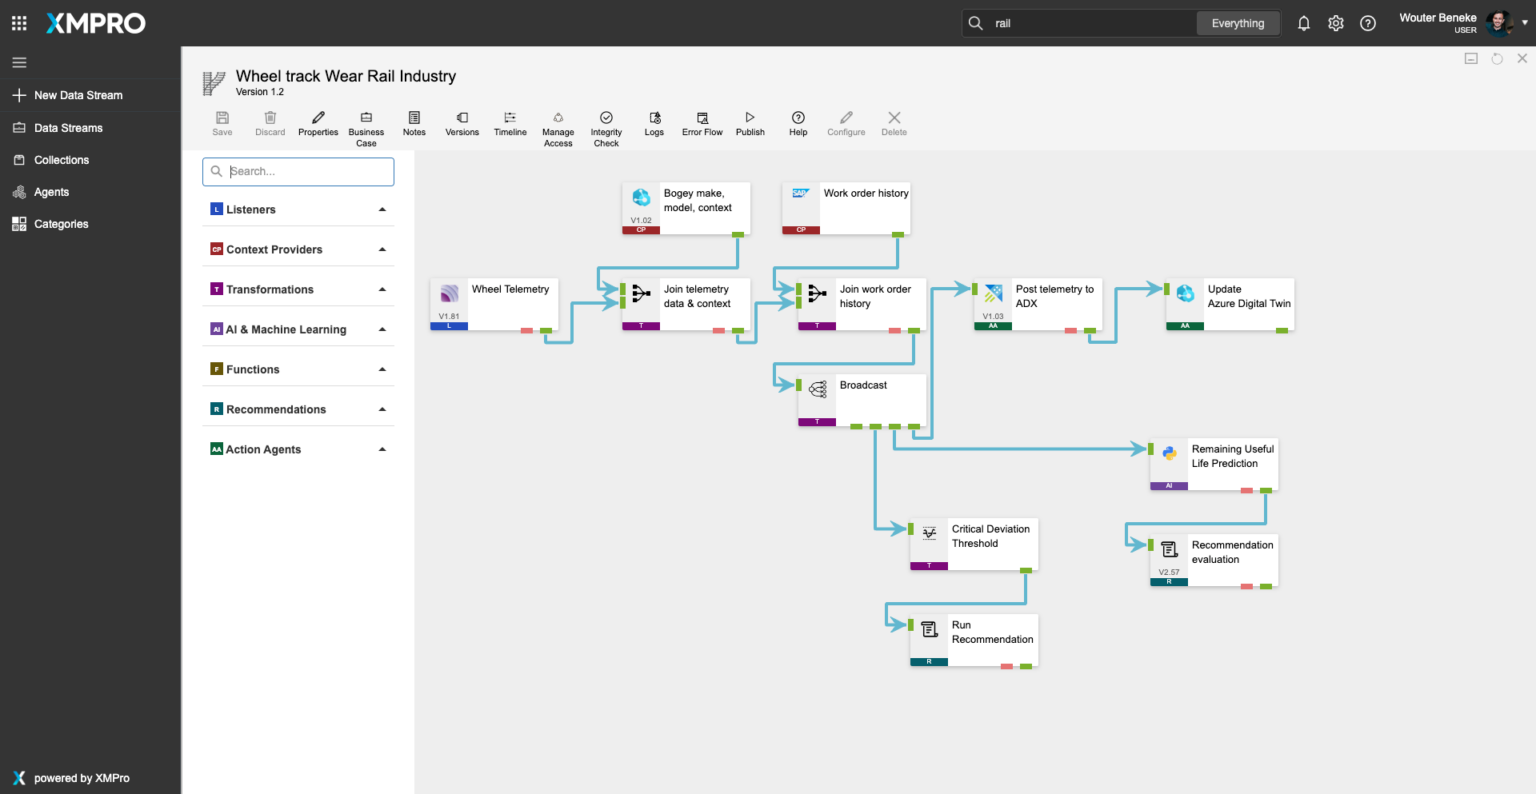
Figure 2: Wheel Track Wear Rail Industry Data Stream
This wheel track wear rail industry data stream ingests real-time telemetry data from wheel sensors and contextual information about the bogey to monitor and analyze wear. The data is combined with historical work order data and broadcasted for further analysis. Critical deviations in wheel and track wear are flagged using predefined thresholds, and a Remaining Useful Life (RUL) model predicts the longevity of the wheels and tracks. The data stream generates maintenance recommendations based on these analyses, and updates the Azure Digital Twin for a real-time digital representation of the assets. All alerts and recommendations are displayed in the XMPro App, providing actionable insights for timely maintenance and operational efficiency.

Recommendation Manager
XMPRO Recommendations are advanced event alerts that combine alerts, actions, and monitoring. You can create recommendations based on business rules and AI logic to recommend the best next actions to take when a certain event happens. You can also monitor the actions against the outcomes they create to continuously improve your decision-making.
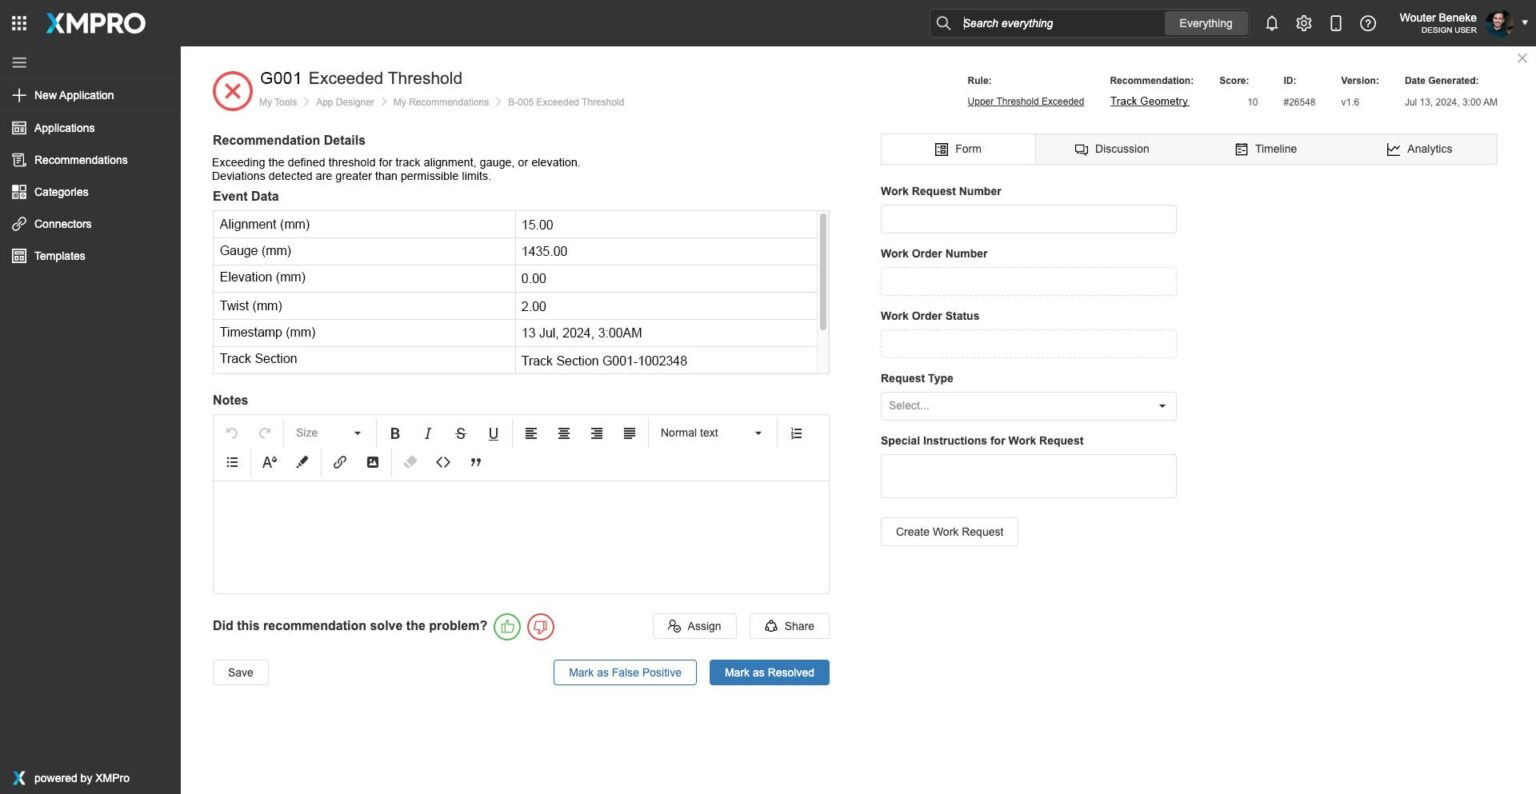
Figure 1: Track Misalignment Threshold Recommendation
This track misalignment threshold recommendation identifies an issue with track alignment exceeding the predefined safety limits. It provides event data, including alignment deviation, gauge, elevation, twist, timestamp, and track section. Users can add notes, mark the recommendation as solved or a false positive, and create a work request with special instructions if necessary. The recommendation helps ensure timely maintenance actions to correct the misalignment and maintain safe railway operations.
Figure 2. Configure With Granular Rule Logic
This example discharge pressure recommendation configuration allows users to set up granular rule logic. The interface enables selecting metrics such as flow rate, discharge pressure, and motor current, and setting specific thresholds to trigger alerts. Users can categorize recommendations, enable execution order, and auto-escalate critical issues.
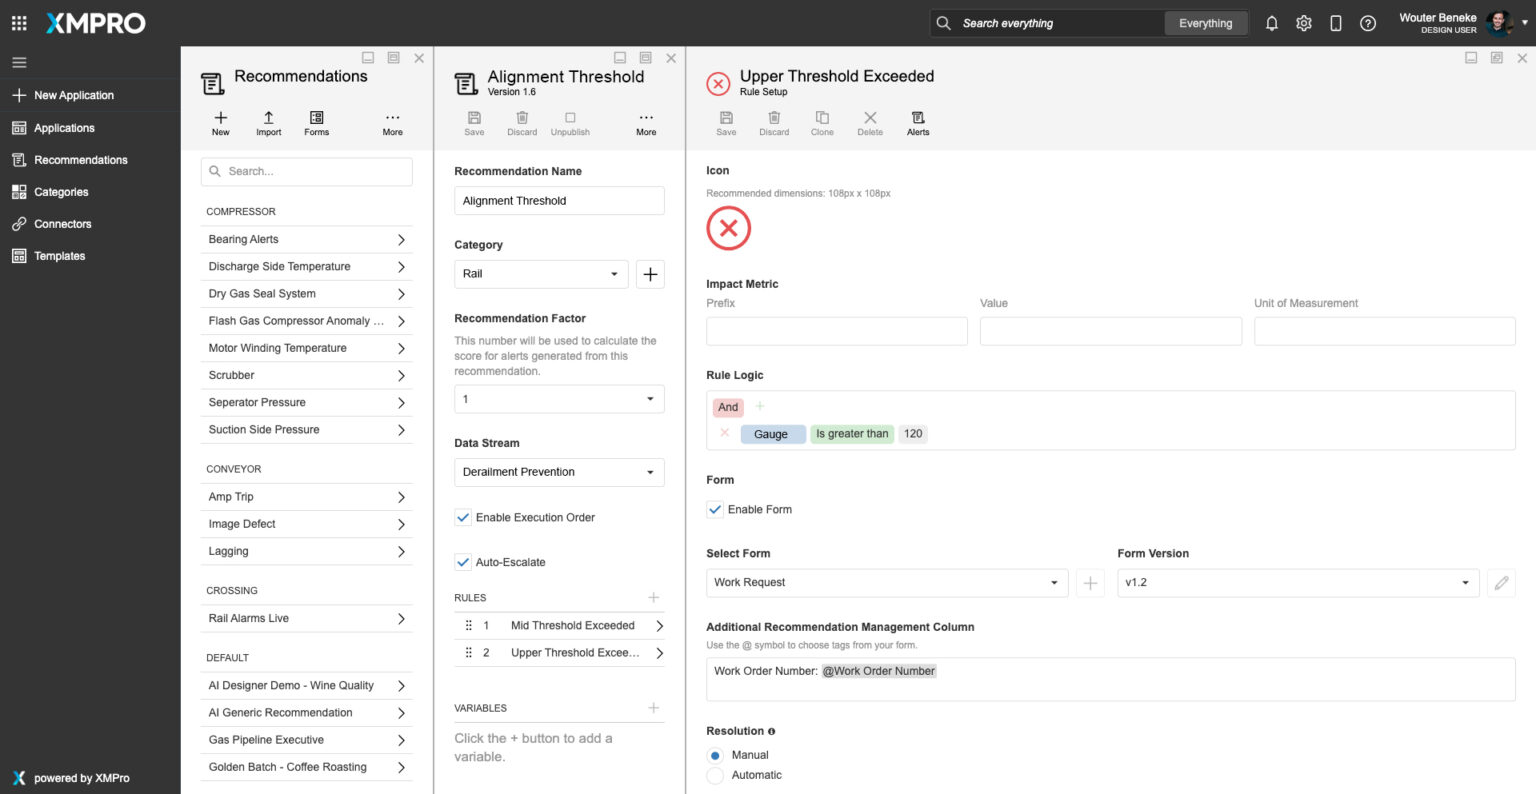
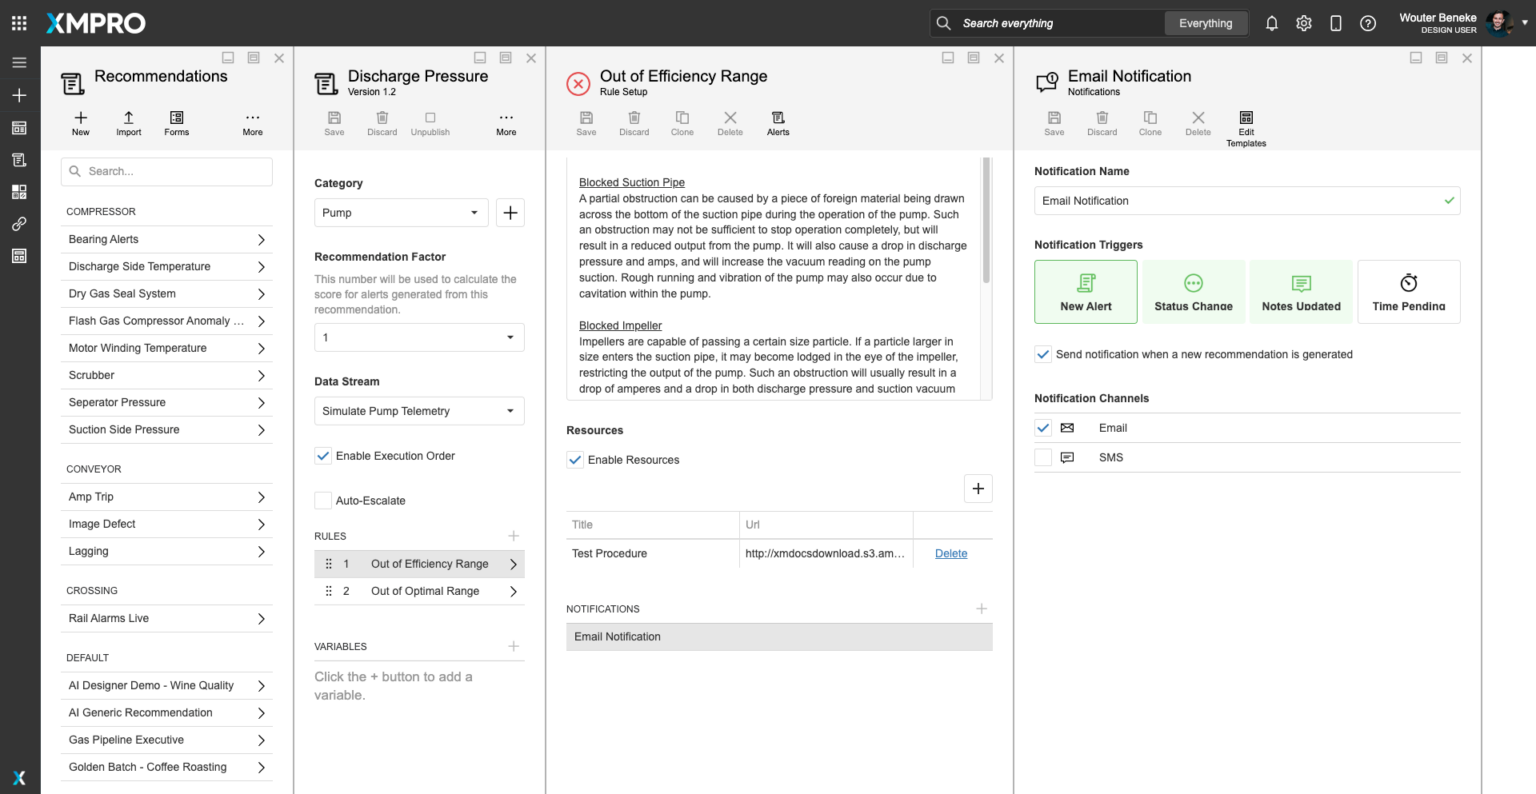
Figure 3. Close The Loop On Event Response
Closing the loop on event response, the system can take various actions, including sending email and SMS notifications for new recommendations, status changes, note updates, and pending times. Additionally, it can automatically create work orders, send information to ERPs, and execute other predefined actions, ensuring comprehensive monitoring and immediate response to pump issues with detailed guidance and timely alerts.
XMPro App Designer
The XMPro App Designer is a no code event intelligence application development platform. It enables Subject Matter Experts (SMEs) to create and deploy real-time intelligent digital twins without programming. This means that SMEs can build apps in days or weeks without further overloading IT, enabling your organization to accelerate and scale your digital transformation.
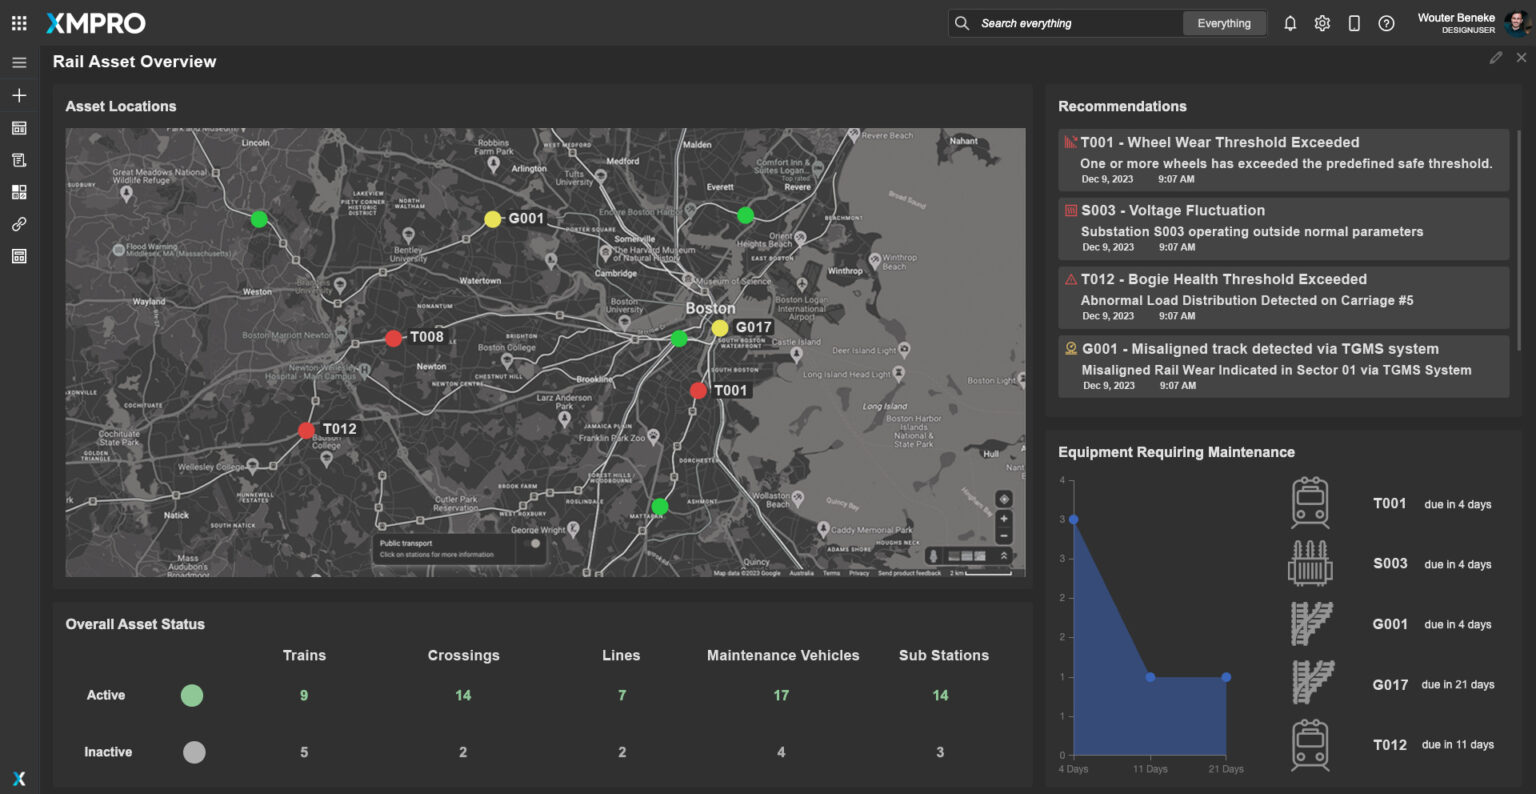
Figure 1. Real-Time Rail Asset Overview Dashboard
This dashboard provides a real-time view of rail assets with an interactive map that updates GPS coordinates of trains and track issues, offering a clear visual of railway lines. Each asset is marked with a color-coded status icon indicating its operational state, including alerts and error messages. The dashboard shows the overall status of asset categories like trains, crossings, tracks, maintenance vehicles, and substations, and highlights active recommendations from the system’s rule logic, such as exceeded bogie wear thresholds.
Dashboard Features
Key Features:
-
Real-Time Asset Locations:
- An interactive map displays real-time GPS locations of rail assets, including trains, crossings, lines, maintenance vehicles, and substations.
-
Color-Coded Status Icons:
- Assets on the map are marked with color-coded icons indicating their current operational status. Green signifies active and operational, yellow indicates warnings, and red represents critical issues needing immediate attention.
-
Overall Asset Status Summary:
- A summary at the bottom provides a quick overview of the total number of active and inactive assets across various categories, including trains, crossings, lines, maintenance vehicles, and substations.
-
Recommendations Panel:
- A list of active recommendations generated by the system’s rule logic, such as exceeded wheel wear thresholds, voltage fluctuations, and bogie health thresholds, ensuring immediate visibility of critical issues.
-
Equipment Requiring Maintenance:
- A detailed graph and list show maintenance requirements across different assets, prioritizing those based on their upcoming service needs. This facilitates efficient maintenance scheduling and ensures timely interventions.
-
Drill-Down Capabilities:
- Each section of the dashboard allows users to drill down into specific asset and recommendation details, providing granular insights and enabling targeted actions based on the system’s recommendations.
-
Alerts and Error Messages:
- Real-time alerts and error messages are displayed, notifying maintenance teams of any detected anomalies that require immediate attention.
-
Interactive Map Controls:
- Users can interact with the map to zoom in/out and click on specific assets to get more detailed information about their status and any ongoing issues.
This comprehensive view ensures that users have all the necessary information at their fingertips to monitor and manage rail assets efficiently, respond quickly to issues, and maintain optimal operational performance.
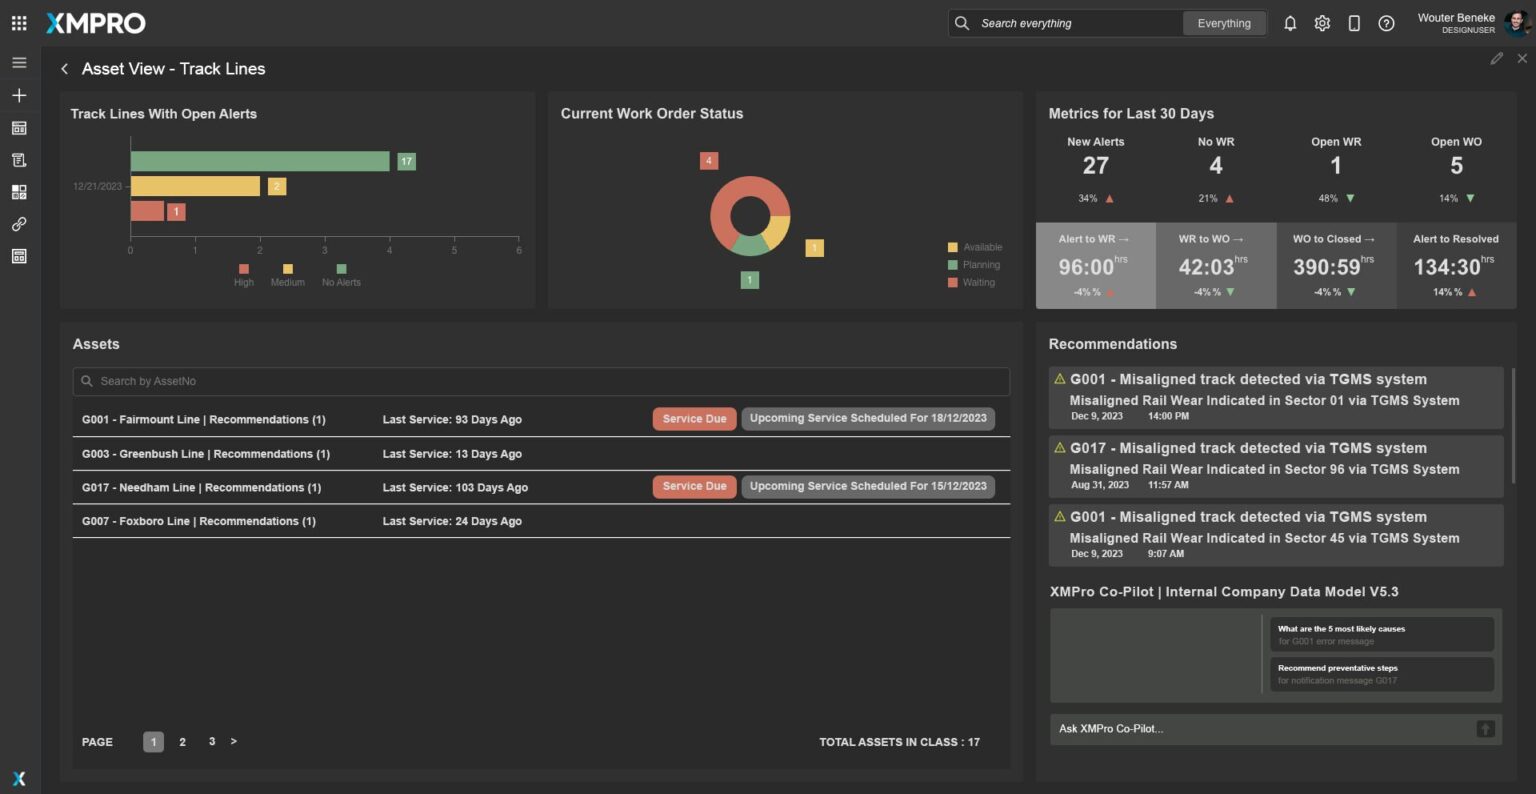
Figure 2. Asset Class Drilldown View
The Asset Class Drilldown view provides an in-depth analysis of rail track lines, presenting a comprehensive overview of current track alerts and work order statuses. It features a bar chart displaying the number of track lines with open alerts categorized by severity (high, medium, and no alerts) and a pie chart summarizing the status of current work orders (available, planning, and waiting). The asset list below details individual track lines, showing their last service dates, recommendations, and upcoming service schedules, allowing users to prioritize maintenance needs efficiently. Key metrics for the past 30 days, including new alerts, work requests, work orders, and time to resolution, are displayed for performance tracking.
Dashboard Features
Key Features
Track Lines with Open Alerts:
A bar chart displaying the number of track lines with open alerts, categorized by severity (high, medium, and no alerts), providing a clear visual representation of current issues.
Current Work Order Status:
A pie chart summarizing the status of current work orders, categorized into available, planning, and waiting. This helps in tracking the progress and status of maintenance and operational tasks.
Metrics for Last 30 Days:
Key performance metrics over the past 30 days, including:
-
-
- New Alerts: The number of new alerts generated.
- No Work Requests (WR): The number of work requests that haven’t been issued.
- Open Work Requests (WR): The number of work requests currently open.
- Open Work Orders (WO): The number of work orders currently open.
- Alert to Work Request (WR) Time: The average time from alert to issuing a work request.
- Work Request (WR) to Work Order (WO) Time: The average time from issuing a work request to creating a work order.
- Work Order (WO) to Closed Time: The average time from creating a work order to closing it.
- Alert to Resolved Time: The average time from alert to resolution.
-
Each metric shows a percentage change from the previous period to indicate performance trends.
Asset List:
A searchable list of individual track lines showing essential information such as last service dates, active recommendations, and upcoming service schedules. Assets are marked with “Service Due” indicators and the date of the next scheduled maintenance.
Recommendations Panel:
A list of critical alerts and recommendations generated by the system, such as misaligned tracks detected by the TGMS system. This panel ensures maintenance teams are aware of urgent issues needing immediate attention.
XMPro Co-Pilot Integration:
The dashboard includes the XMPro Co-Pilot feature, offering insights and recommendations for error messages and preventative steps for detected issues, enhancing decision-making and maintenance efficiency.
These features collectively provide a comprehensive view of track line asset health, facilitate efficient maintenance scheduling, and ensure timely attention to critical issues, thereby maintaining optimal operational efficiency.
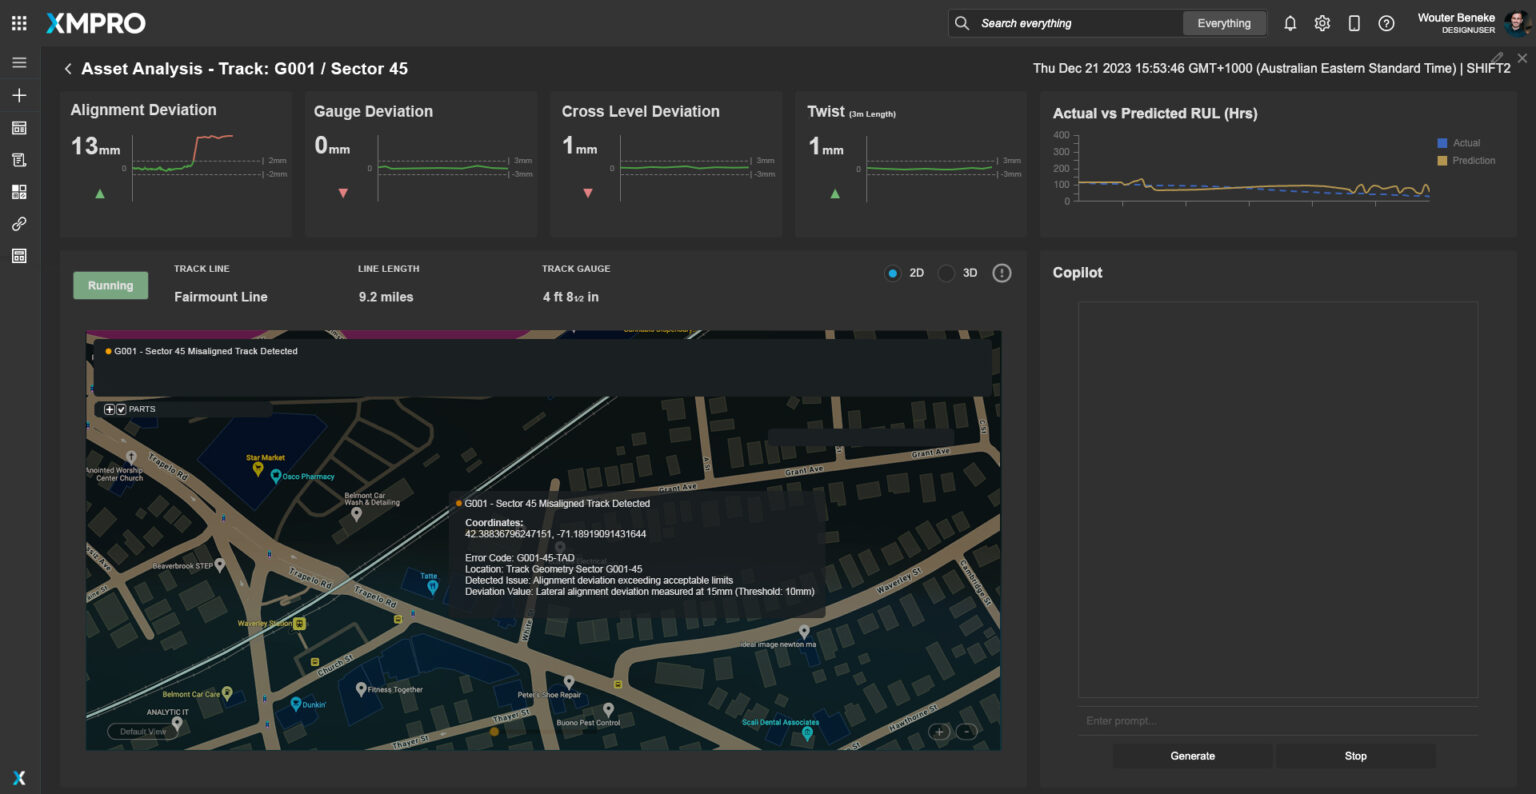
Figure 3. Track Geometry Segment View
Dashboard Features
Figure 3. Asset Analysis View – Track Geometry Segment
This Asset Analysis View delivers in-depth insights into specific track geometry sectors, with a focus on Sector G001-45.
Comprehensive Track Geometry Health Metrics: This section showcases essential health indicators for Track Geometry Sector G001-45, including alignment, gauge, elevation, and twist. Real-time data is juxtaposed with predictive analytics, enabling forecasts of potential issues and aiding in proactive maintenance.
Interactive 2D and 3D Track Models: Detailed 2D and 3D models of Sector G001-45 are presented, with features that allow for an expanded view of particular areas. Sections flagged for potential wear or misalignment are highlighted, aiding in quick identification. For example, areas deviating from standard geometry specifications are distinctly color-marked.
Error Identification and Proactive Recommendations: Clickable sections in the track model lead users to specific error details and associated recommendations. This integration with XMPro’s Recommendation Manager streamlines the process for identifying and addressing track issues.
Detailed Information on Track Sector G001-45 The dashboard offers a comprehensive profile of Sector G001-45, including its type, operational history, and unique characteristics, providing a full understanding of its maintenance requirements.
XMPro Co-Pilot Integration: Incorporating XMPro Co-Pilot, this feature utilizes AI, trained on datasets such as historical track data and maintenance records, to provide specific guidance for issues related to Sector G001-45. This AI-driven assistance supports informed decision-making and enhances maintenance efficiency.
This Asset Analysis View is specifically designed to give a complete picture of the health of Track Geometry Sector G001-45, merging sophisticated visual models with data-driven insights and AI-powered recommendations for effective management in the rail industry.

XMPro AI
Experience the transformative power of XMPro’s Intelligent Business Operations Suite (iBOS) – Featuring comprehensive AI capabilities, XMPro iBOS helps to significantly increase product yield, drastically reduce downtime, and ultimately eliminate unexpected business events.
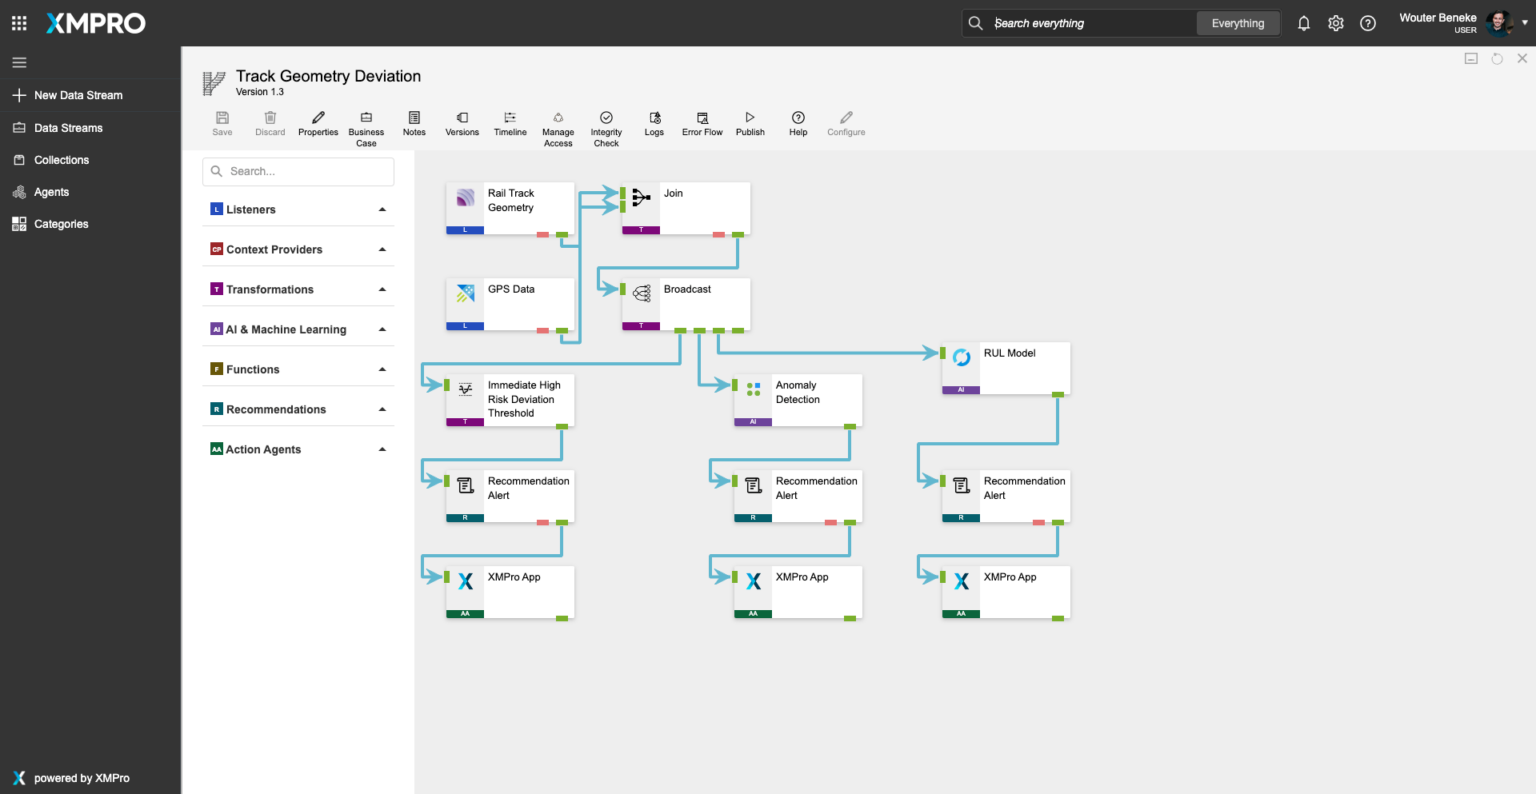
Figure 1: Embedded AI Example – Track Geometry Deviation
Embedding XMPro AI Agents in XMPro Data Streams enables executable AI and machine learning for algorithmic business processes, significantly enhancing the capabilities of operational digital twins. This integration allows for advanced features such as real-time analytics, MLOps, and the seamless embedding of AI into core business processes.
In the example of track geometry deviation, XMPro’s AI Agents empower the data stream to accurately identify and predict potential track misalignments. The process begins with the ingestion of real-time sensor data, including alignment, gauge, elevation, and twist, combined with GPS data and historical maintenance records. The data is normalized and contextualized with track section and location information from digital twins. Machine learning models, including anomaly detection and remaining useful life (RUL) prediction, are applied to detect deviations and forecast maintenance needs. The results are filtered, merged, and broadcasted for further action. The data stream generates actionable insights for maintenance scheduling and resource allocation, ensuring optimal track alignment and minimizing the risk of derailments.
XMPro Embedded AI Agents
Embedded AI Agents
XMPro offers a variety of AI agents to support diverse operational needs, including:
- Azure OpenAI: Enhances natural language processing capabilities.
- OpenAI Assistant: Facilitates conversational AI integrations.
- Anomaly Detection: Identifies unusual patterns in data to prevent operational failures.
- Forecasting: Predicts future trends based on historical data.
- Kmeans Clustering: Groups similar data points for more effective analysis.
- MLflow: Manages the machine learning lifecycle, including experimentation, reproducibility, and deployment.
- Regression: Provides predictive analytics to understand relationships between variables.
By embedding these powerful AI agents, XMPro transforms AI models into valuable assets that drive business growth and efficiency, bridging the gap between data flow and operational AI.
Use XMPro Blueprints for Quick Time To Value
Easily import Blueprints, Accelerators and Patterns into your environment, providing a starting point for configuring your own solutions.
Why XMPro iBOS for Derailment Prevention In the Rail Industry?
XMPro’s Intelligent Business Operations Suite (iBOS) is uniquely equipped to address the complexities of Bogie Health Monitoring in the rail industry, utilizing cutting-edge technology and analytics. Here’s how XMPro iBOS excels in this application:

Intelligent Digital Twin for Rail Infrastructure:
XMPro iBOS creates a digital twin of the rail infrastructure, accurately mirroring the physical tracks. This digital representation allows for sophisticated simulation and analysis of track geometry, enabling predictive maintenance and early detection of potential derailment risks.
Seamless Data Integration and Transformation:
Featuring a robust integration library, XMPro iBOS seamlessly incorporates data from various sensors, including gauge & alignment on tracks. This integration is key to transforming raw data into meaningful insights for predictive maintenance.
Predictive Analytics for Anomaly Detection:
Utilizing machine learning algorithms, XMPro iBOS analyzes the sensor data to identify anomalies and deviations in track geometry that could lead to derailments. This predictive approach allows for early intervention and maintenance planning.
Maintenance Scheduling Optimization:
By analyzing data-driven insights on track conditions, XMPro iBOS helps optimize maintenance schedules. This shift from fixed-interval to condition-based maintenance reduces costs and minimizes operational disruptions.

Real-Time Alerts and Proactive Decision Making:
XMPro iBOS provides real-time monitoring of track conditions, with an alert system that notifies maintenance teams of any detected issues requiring immediate attention.
Configurable Dashboards for Enhanced Decision-Making:
The solution includes customizable dashboards that present key data and insights on track conditions, alongside comprehensive reporting features for maintenance planning and regulatory compliance.
Scalability and Flexibility – Start Small, Scale Fast:
XMPro iBOS is scalable and flexible, capable of adapting to different sizes of rail networks and integrating with various types of track geometry measurement technologies.

Enhanced Safety and Operational Efficiency:
By enabling proactive maintenance and early detection of track issues, XMPro iBOS enhances the safety and operational efficiency of rail systems, reducing the risk of accidents and ensuring reliable service.

Quick Time To Value – XMPro Blueprints
Utilize XMPro blueprints, pre-configured for track alignment monitoring to quickly set up the digital twin dashboard. These blueprints integrate industry best practices, ensuring a swift and effective implementation.
In summary, XMPro iBOS addresses the unique challenges of derailment prevention through track geometry measurement by providing a comprehensive, real-time, predictive, and integrated solution. Its capabilities in digital twin technology, advanced sensor data integration, machine learning for anomaly detection, and effective visualization tools make it a powerful tool for enhancing rail safety and maintenance efficiency.
Not Sure How To Get Started?
No matter where you are on your digital transformation journey, the expert team at XMPro can help guide you every step of the way - We have helped clients successfully implement and deploy projects with Over 10x ROI in only a matter of weeks!
Request a free online consultation for your business problem.
"*" indicates required fields