


Condition Monitoring For Hydraulics in the Manufacturing Industry
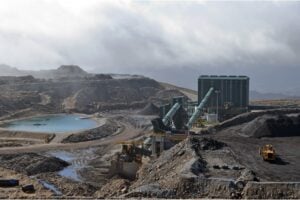
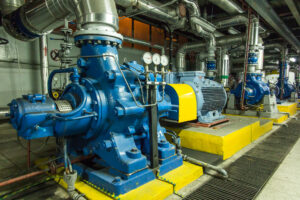
Manufacturing facilities depend heavily on hydraulic systems for critical operations, such as powering machinery, presses, and lifting systems. As manufacturing plants modernize with the adoption of smart technologies, hydraulic system condition monitoring is becoming essential for maintaining efficiency, reducing downtime, and ensuring safety. Sophisticated asset condition monitoring solutions are required to manage and optimize the
Manufacturing facilities depend heavily on hydraulic systems for critical operations, such as powering machinery, presses, and lifting systems. As manufacturing plants modernize with the adoption of smart technologies, hydraulic system condition monitoring is becoming essential for maintaining efficiency, reducing downtime, and ensuring safety.
Sophisticated asset condition monitoring solutions are required to manage and optimize the performance of hydraulic systems, minimizing interruptions and maximizing their lifespan.
The Challenge
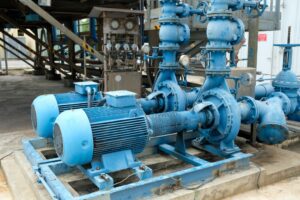
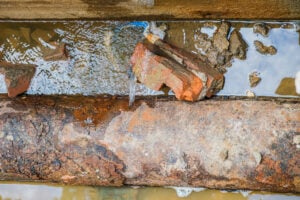
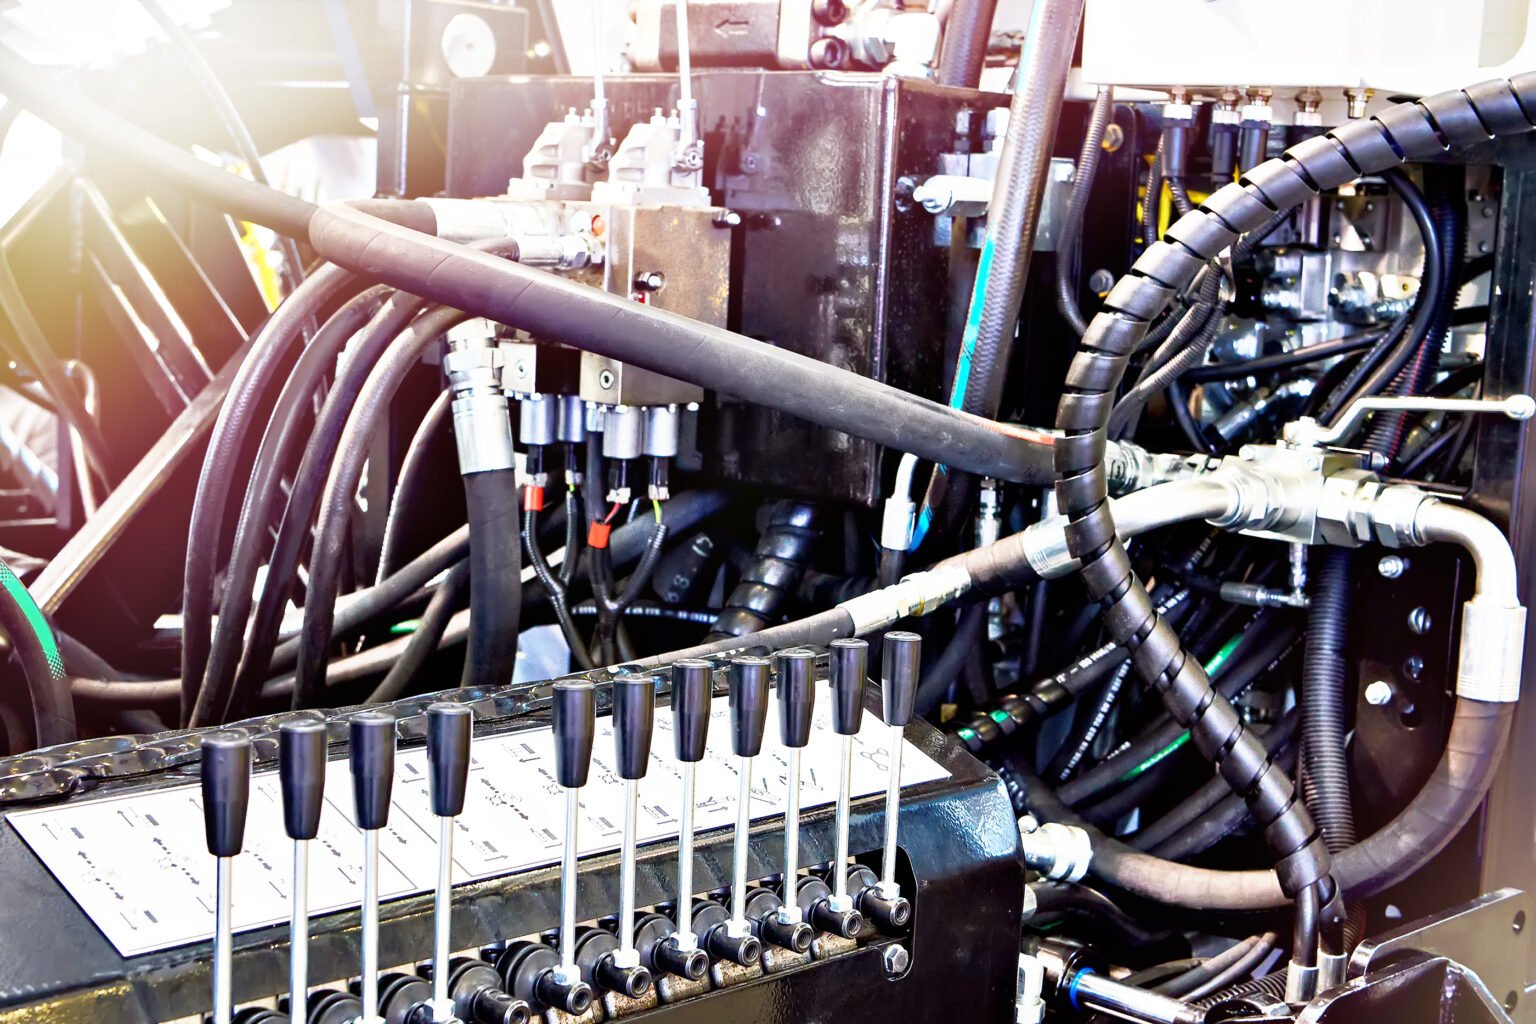
Hydraulic systems are crucial to many industrial processes, ensuring that production equipment operates smoothly. However, due to their continuous operation, these systems are prone to wear, leaks, and unexpected failures if not closely monitored.
Maintaining hydraulic system health requires careful tracking of parameters such as pressure, fluid levels, temperature, flow rates, and power consumption. Without an integrated monitoring solution, identifying issues early can be a significant challenge, leading to costly downtime and inefficiencies.
The Solution: XMPro iBOS for Hydraulic System Monitoring in Manufacturing
XMPro’s Intelligent Business Operations Suite (iBOS) is tailored to meet the complex demands of hydraulic system condition monitoring in manufacturing environments. By leveraging data from sensors embedded in hydraulic systems, XMPro offers a powerful solution that optimizes performance, predicts potential failures, and schedules maintenance based on real-time data. XMPro enhances the monitoring process with real-time data visualization, predictive analytics, and automated recommendations, making hydraulic system monitoring efficient, reliable, and scalable.
Key Features
Key Features:
How XMPro iBOS Modules Work Together for Compressor Monitoring
- Data Integration & Transformation: XMPro’s platform seamlessly integrates real-time data from compressors, including vibration, pressure, temperature, and airflow metrics. This data is transformed into actionable insights, allowing manufacturers to detect early signs of issues and make informed decisions.
- Intelligence & Decision Making: Advanced analytics and AI-driven models predict compressor failures before they happen. By continuously learning from historical data, the system refines maintenance schedules and improves decision-making processes, reducing downtime.
- Visualization & Event Response: XMPro’s real-time dashboards display compressor health metrics and alert operators to any anomalies. The system provides visual cues and recommendations to ensure immediate response to critical conditions, preventing potential equipment failures.
- Artificial Intelligence & Generative Agents: XMPro’s AI-based agents continuously monitor compressor performance, generating automated alerts and suggestions for optimizing performance and preventing unexpected breakdowns.
How XMPro iBOS Modules Work Together To Create This Condition Monitoring Solution
Integration & Transformation
Intelligence & Decision Making
Visualization & Event Response

Artificial Intelligence &
Generative Agents


XMPro Data Stream Designer
XMPro’s Data Stream Designer allows manufacturers to visually design data flows for real-time applications. This includes bringing in data from multiple sensors (e.g., pressure, temperature, flow monitors) and contextualizing it with operational data. The result: streamlined hydraulic system management that supports both maintenance and performance optimization.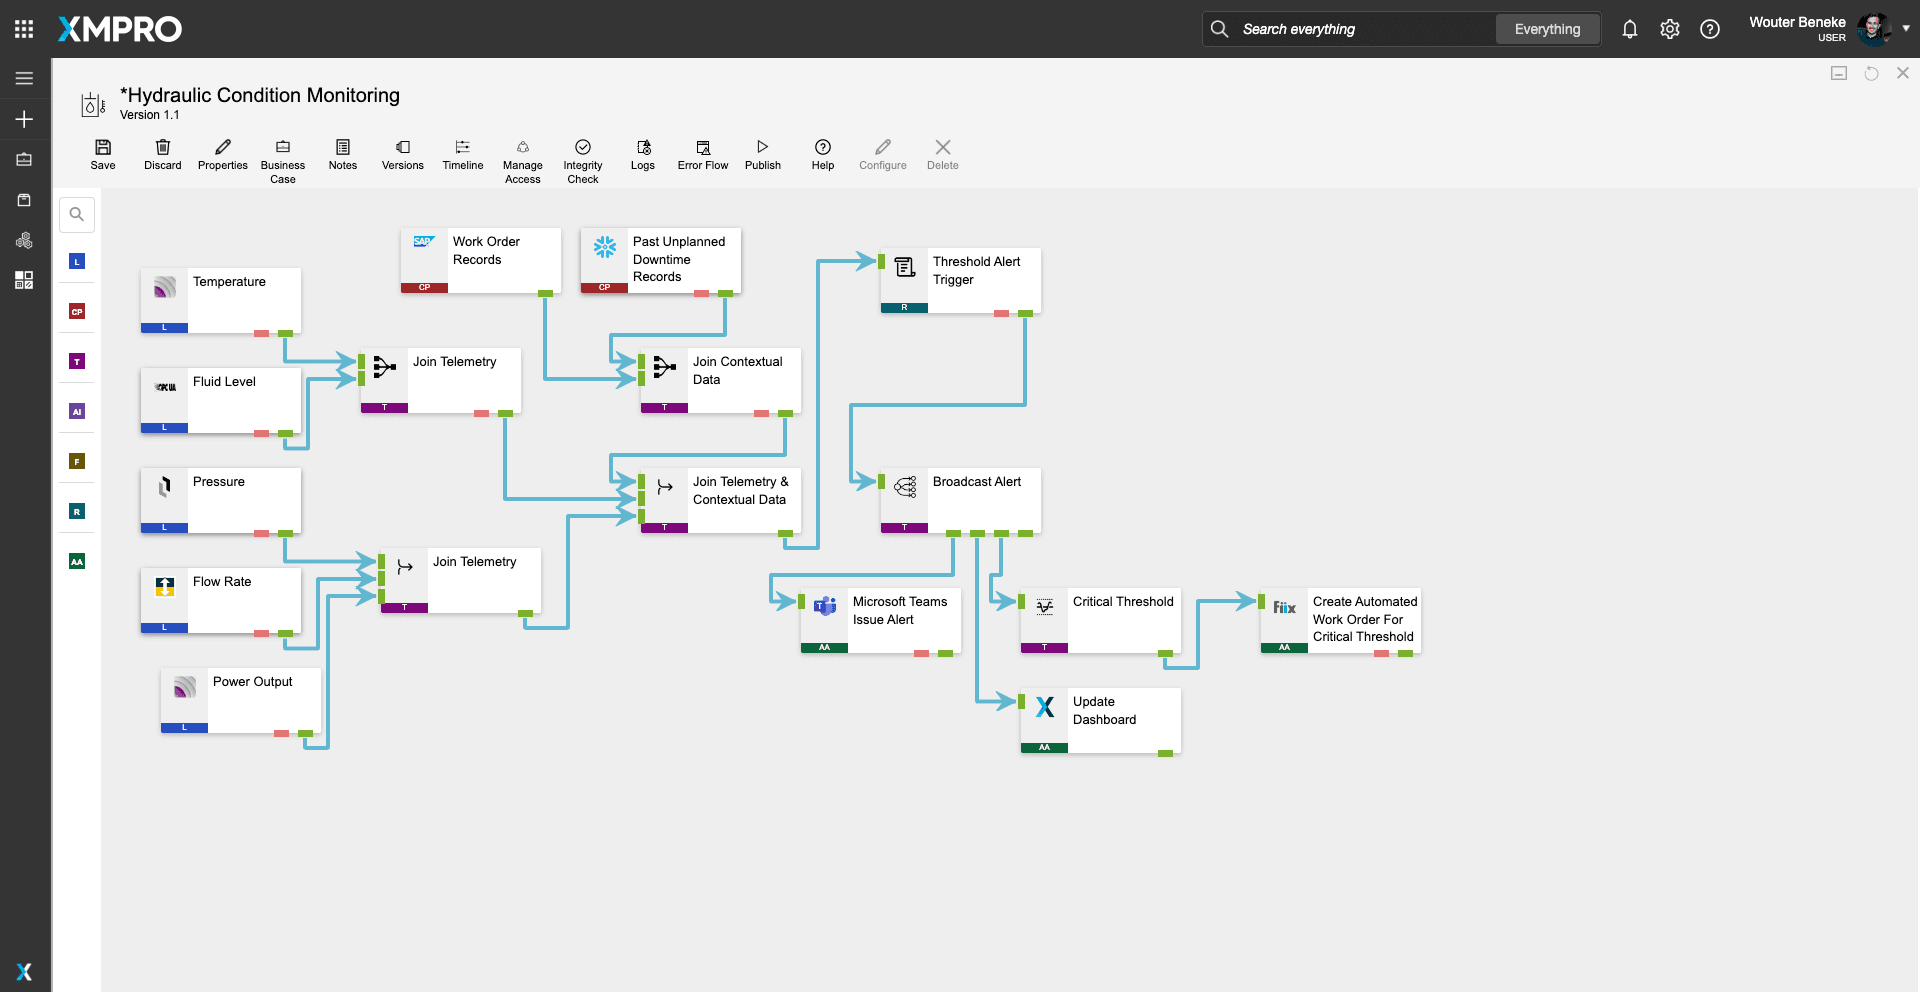
Figure1. Data Stream – Hydraulic System Condition Monitoring
This Data Stream continuously collects and processes real-time data from key hydraulic parameters such as pressure, temperature, fluid levels, and flow rates.
The data is synchronized and compared against predefined thresholds to detect anomalies or potential failures. If any parameter exceeds its threshold, an automated recommendation is generated, suggesting actions like scheduling maintenance or adjusting operations.
The system then broadcasts this information via multiple channels, including email notifications, Microsoft Teams alerts, and an alert dashboard. This comprehensive monitoring setup ensures that stakeholders are promptly informed of critical issues, enabling proactive maintenance and preventing potential failures, thus optimizing the hydraulic system’s operational efficiency and reducing downtime.

Recommendation Manager
XMPRO Recommendations are advanced event alerts that combine alerts, actions, and monitoring. You can create recommendations based on business rules and AI logic to recommend the best next actions to take when a certain event happens. You can also monitor the actions against the outcomes they create to continuously improve your decision-making.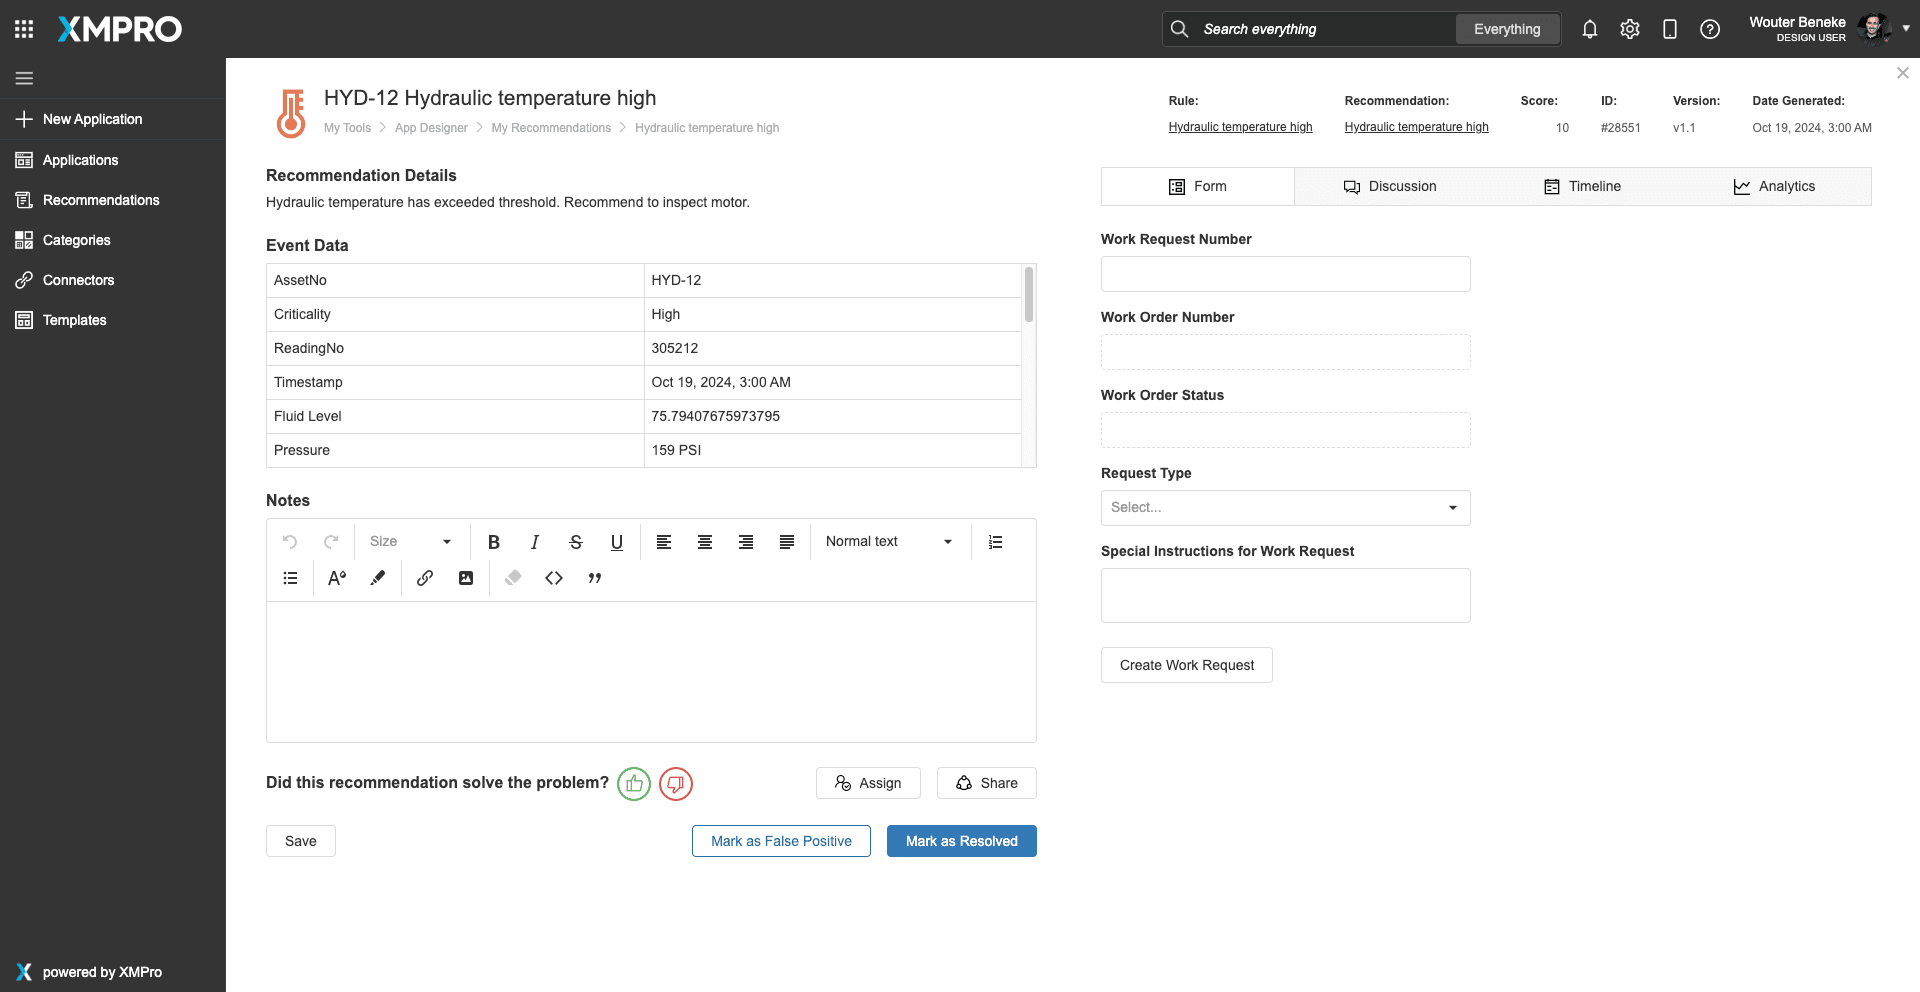
Figure 1. High Temperature Recommendation
This high temperature exception recommendation identifies an issue with the hydraulic system's operating temperature exceeding the specified threshold. It provides event data, including hydraulic ID, location, temperature reading, timestamp, motor current, and coolant pressure. Users can add notes, mark the recommendation as resolved or a false positive, and create a work request with special instructions if necessary.
Figure 2. Configure With Granular Rule Logic
This hydraulic temperature recommendation configuration allows users to set up granular rule logic for monitoring hydraulic conditions. The interface enables selecting metrics such as temperature, pressure, fluid levels, and setting specific thresholds to trigger alerts. Users can categorize recommendations, define execution order, and auto-escalate critical temperature-related issues.
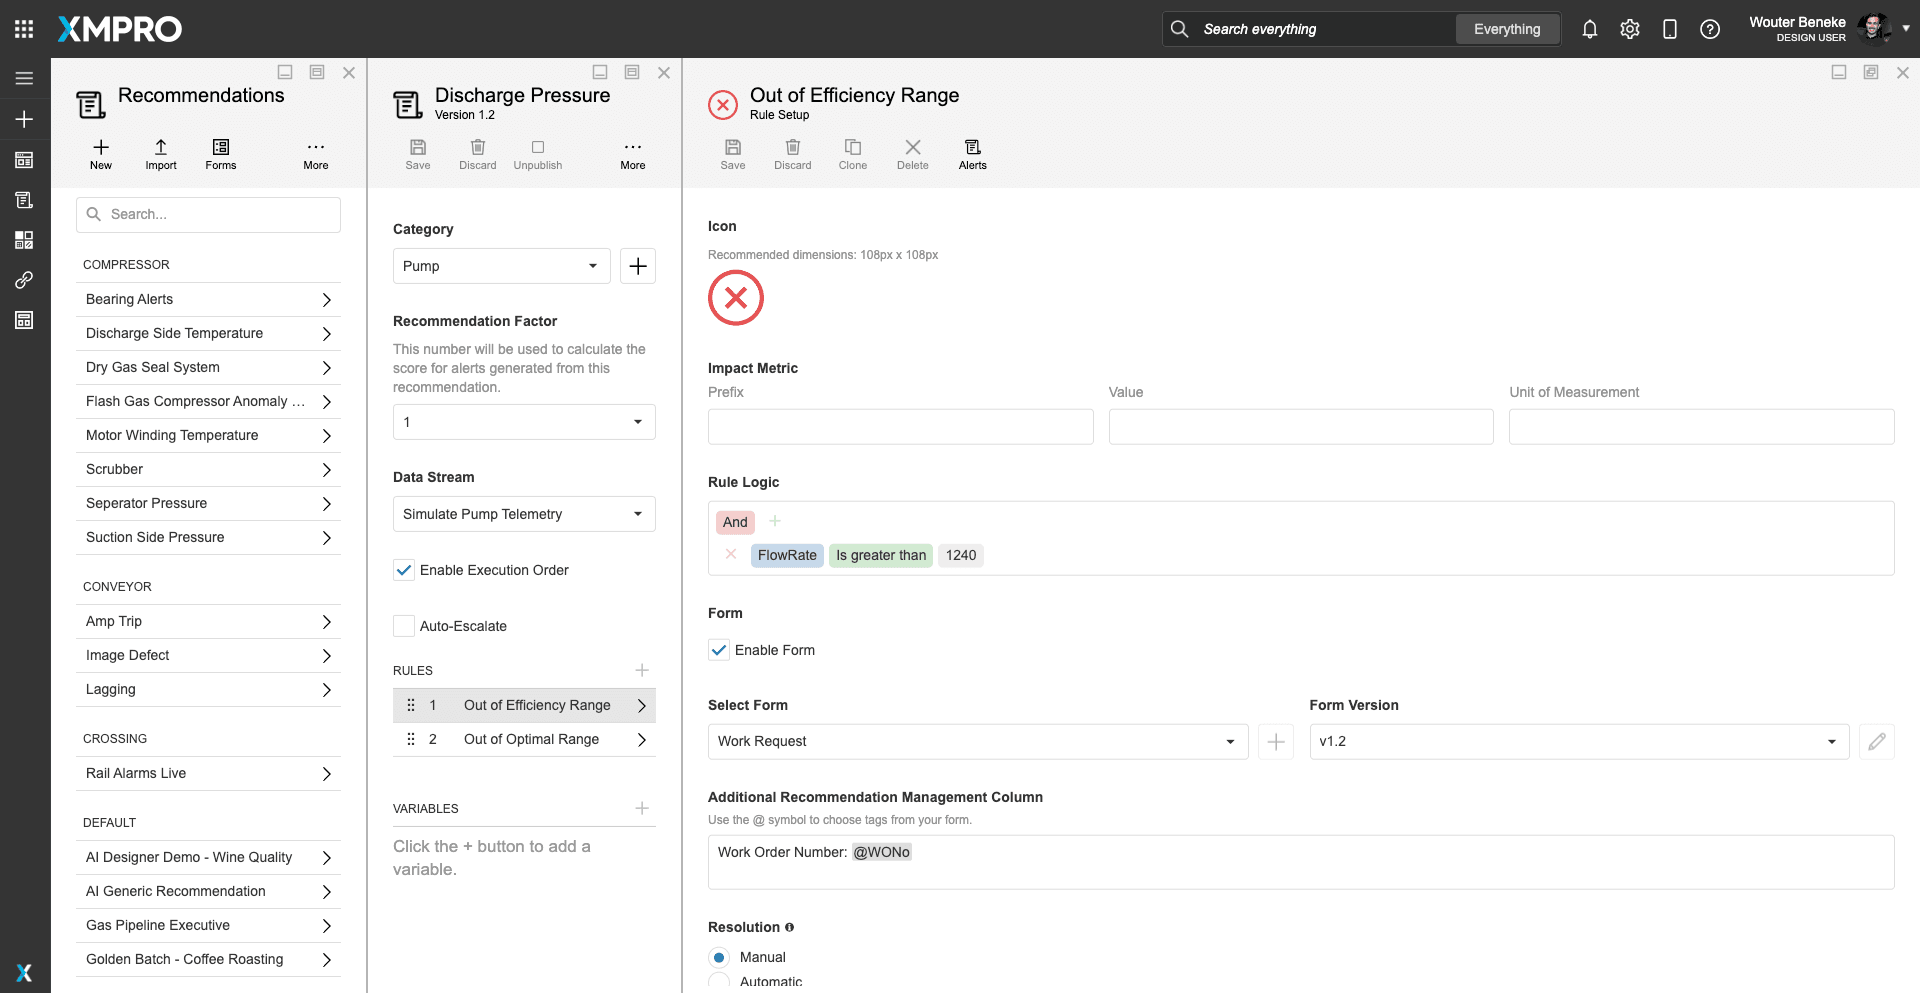
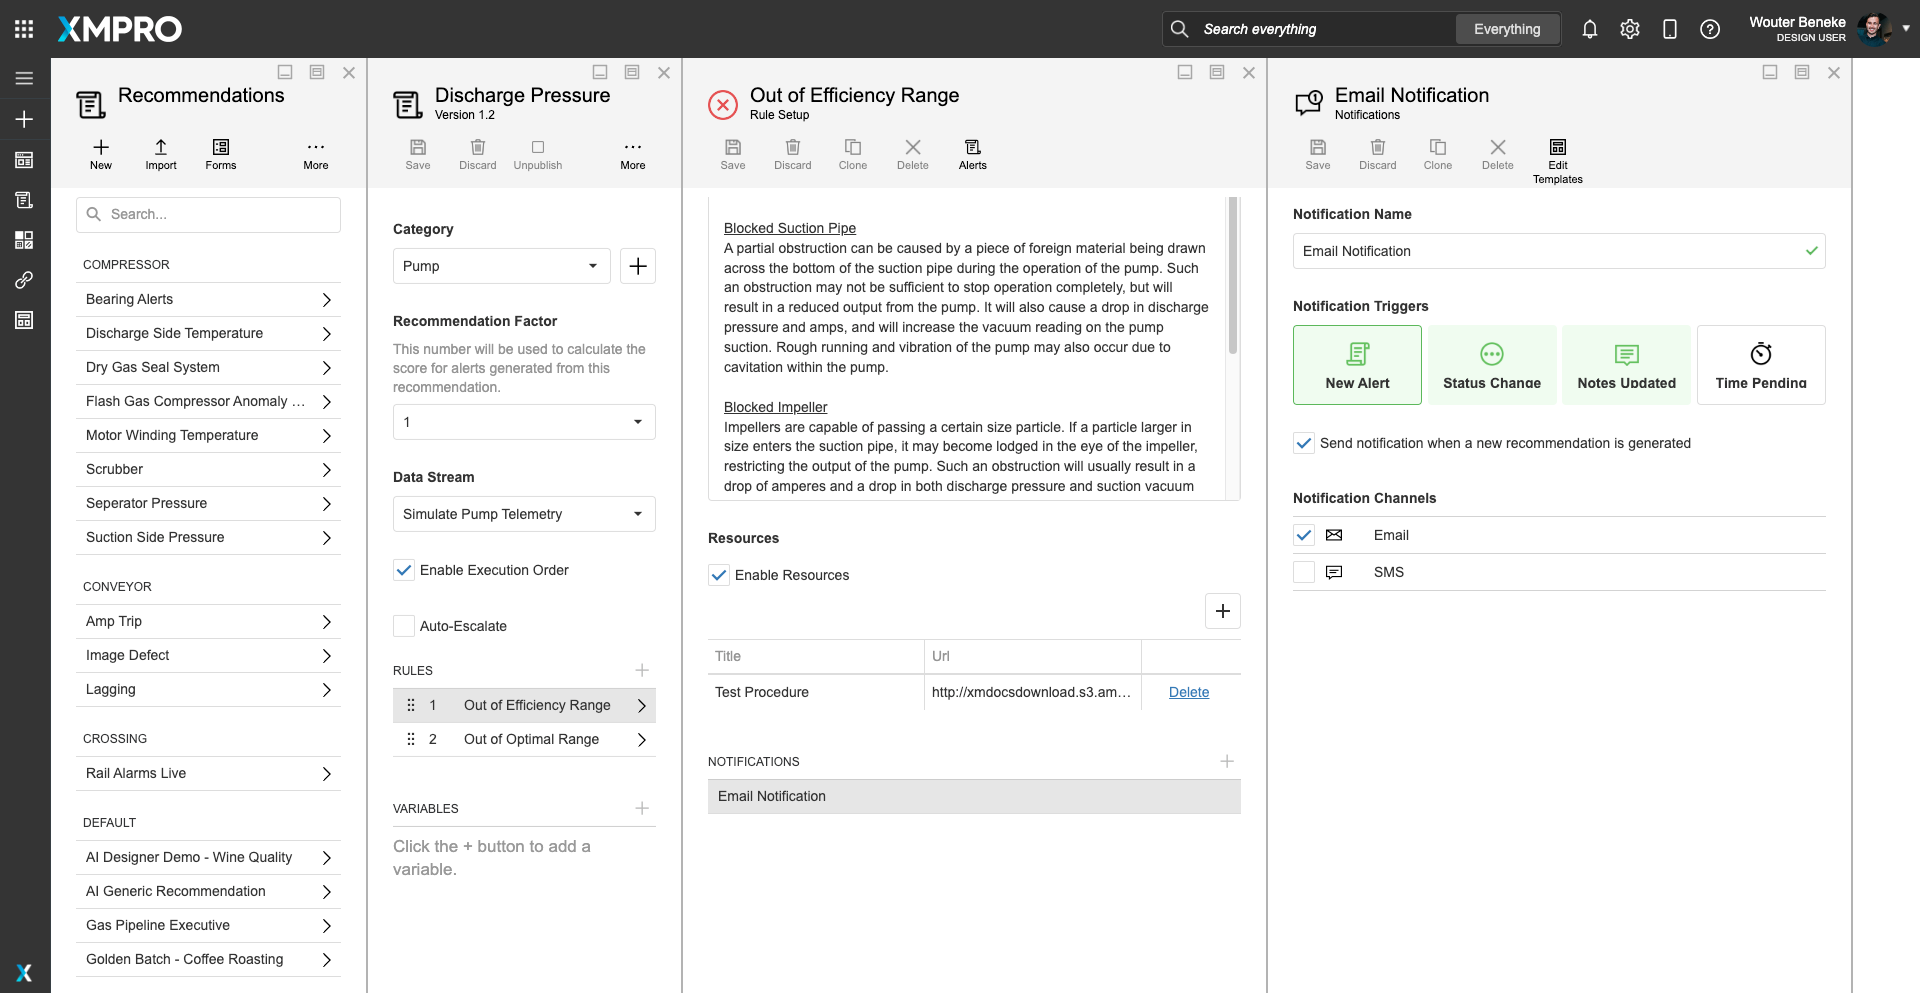
Figure 3. Close The Loop On Event Response
Closing the loop on event response, the system can take various actions, including sending email and SMS notifications for new recommendations, status changes, note updates, and pending times. Additionally, it can automatically create work orders, send information to ERPs, and execute other predefined actions, ensuring comprehensive monitoring and immediate response to hydraulic issues with detailed guidance and timely alerts.
XMPro App Designer
The XMPro App Designer is a no code event intelligence application development platform. It enables Subject Matter Experts (SMEs) to create and deploy real-time intelligent digital twins without programming. This means that SMEs can build apps in days or weeks without further overloading IT, enabling your organization to accelerate and scale your digital transformation.
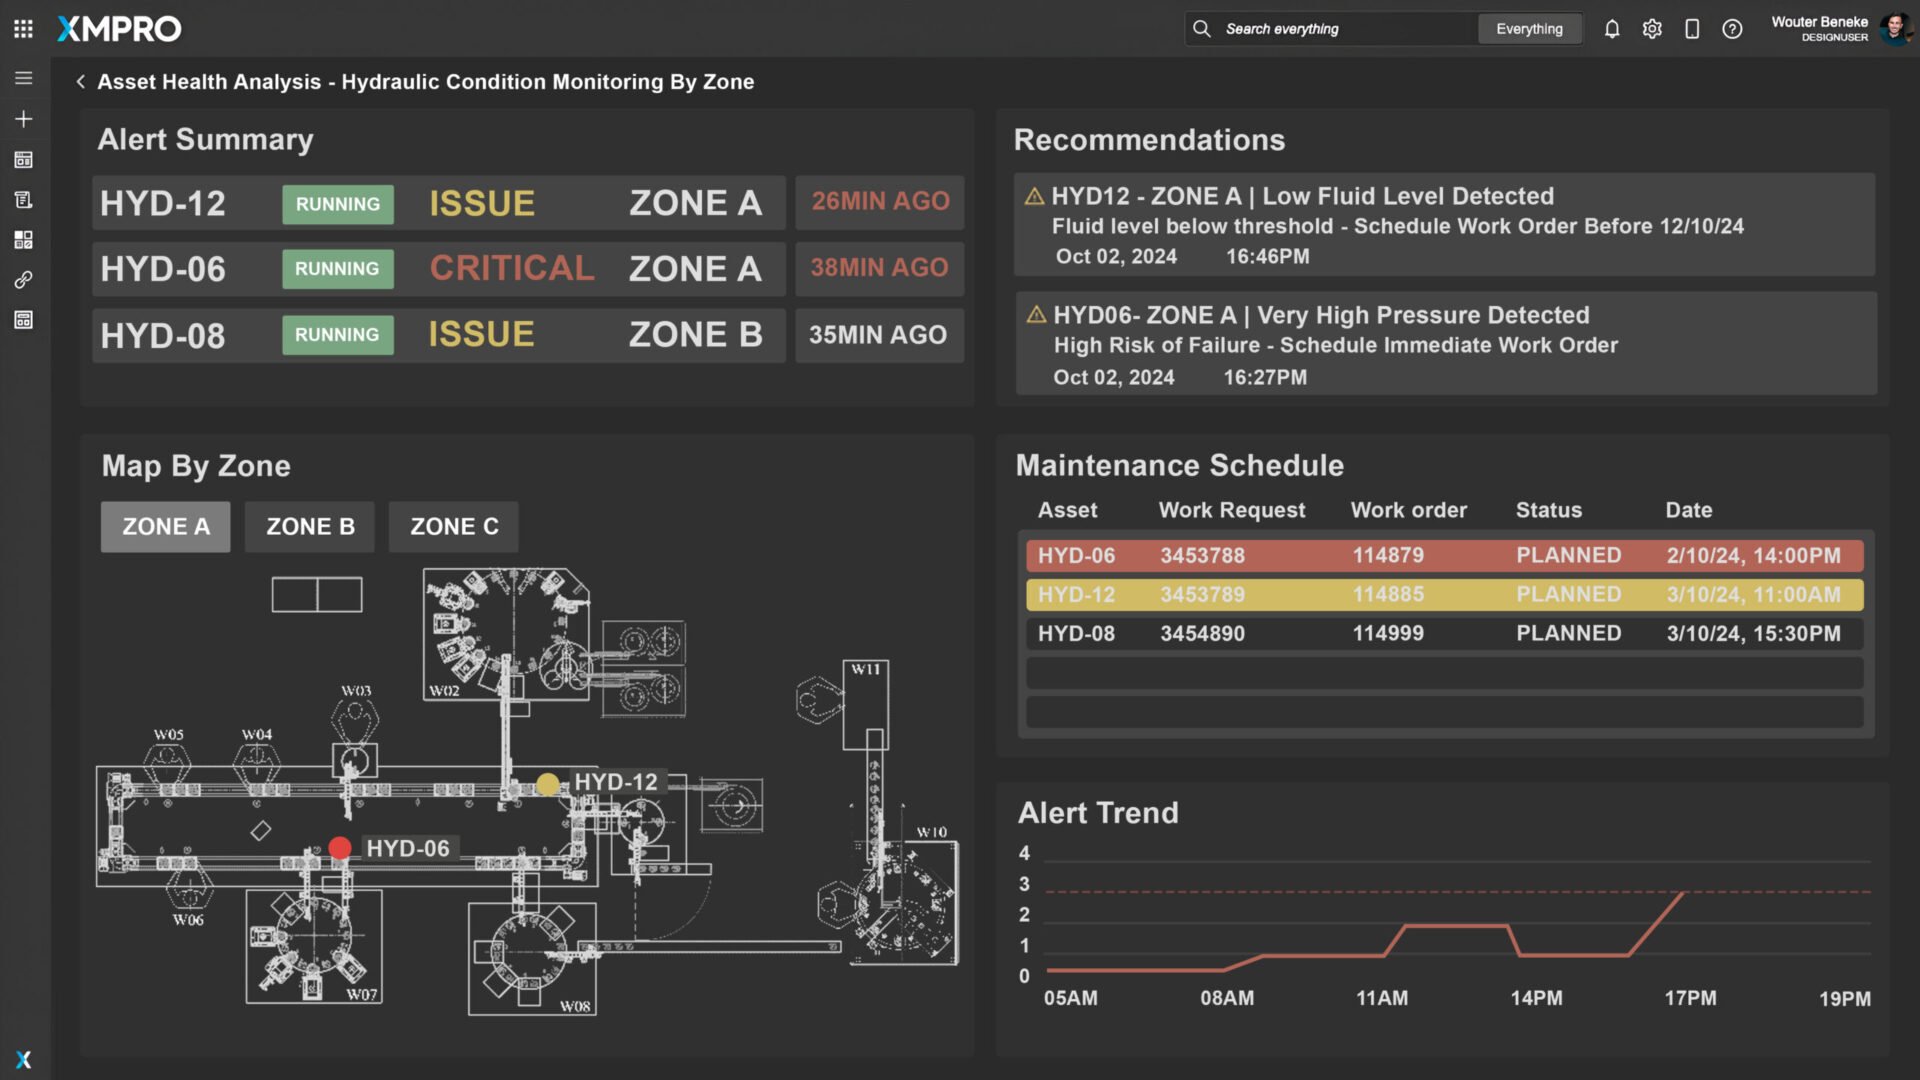
Figure 1. Zone-Based Hydraulic Condition Monitoring Dashboard
The Zone-Based Hydraulic Condition Monitoring dashboard provides a real-time overview of the operational status of hydraulic systems across different factory zones. This dashboard empowers facility managers with an immediate understanding of equipment health and performance, ensuring the continuous and efficient operation of critical systems.
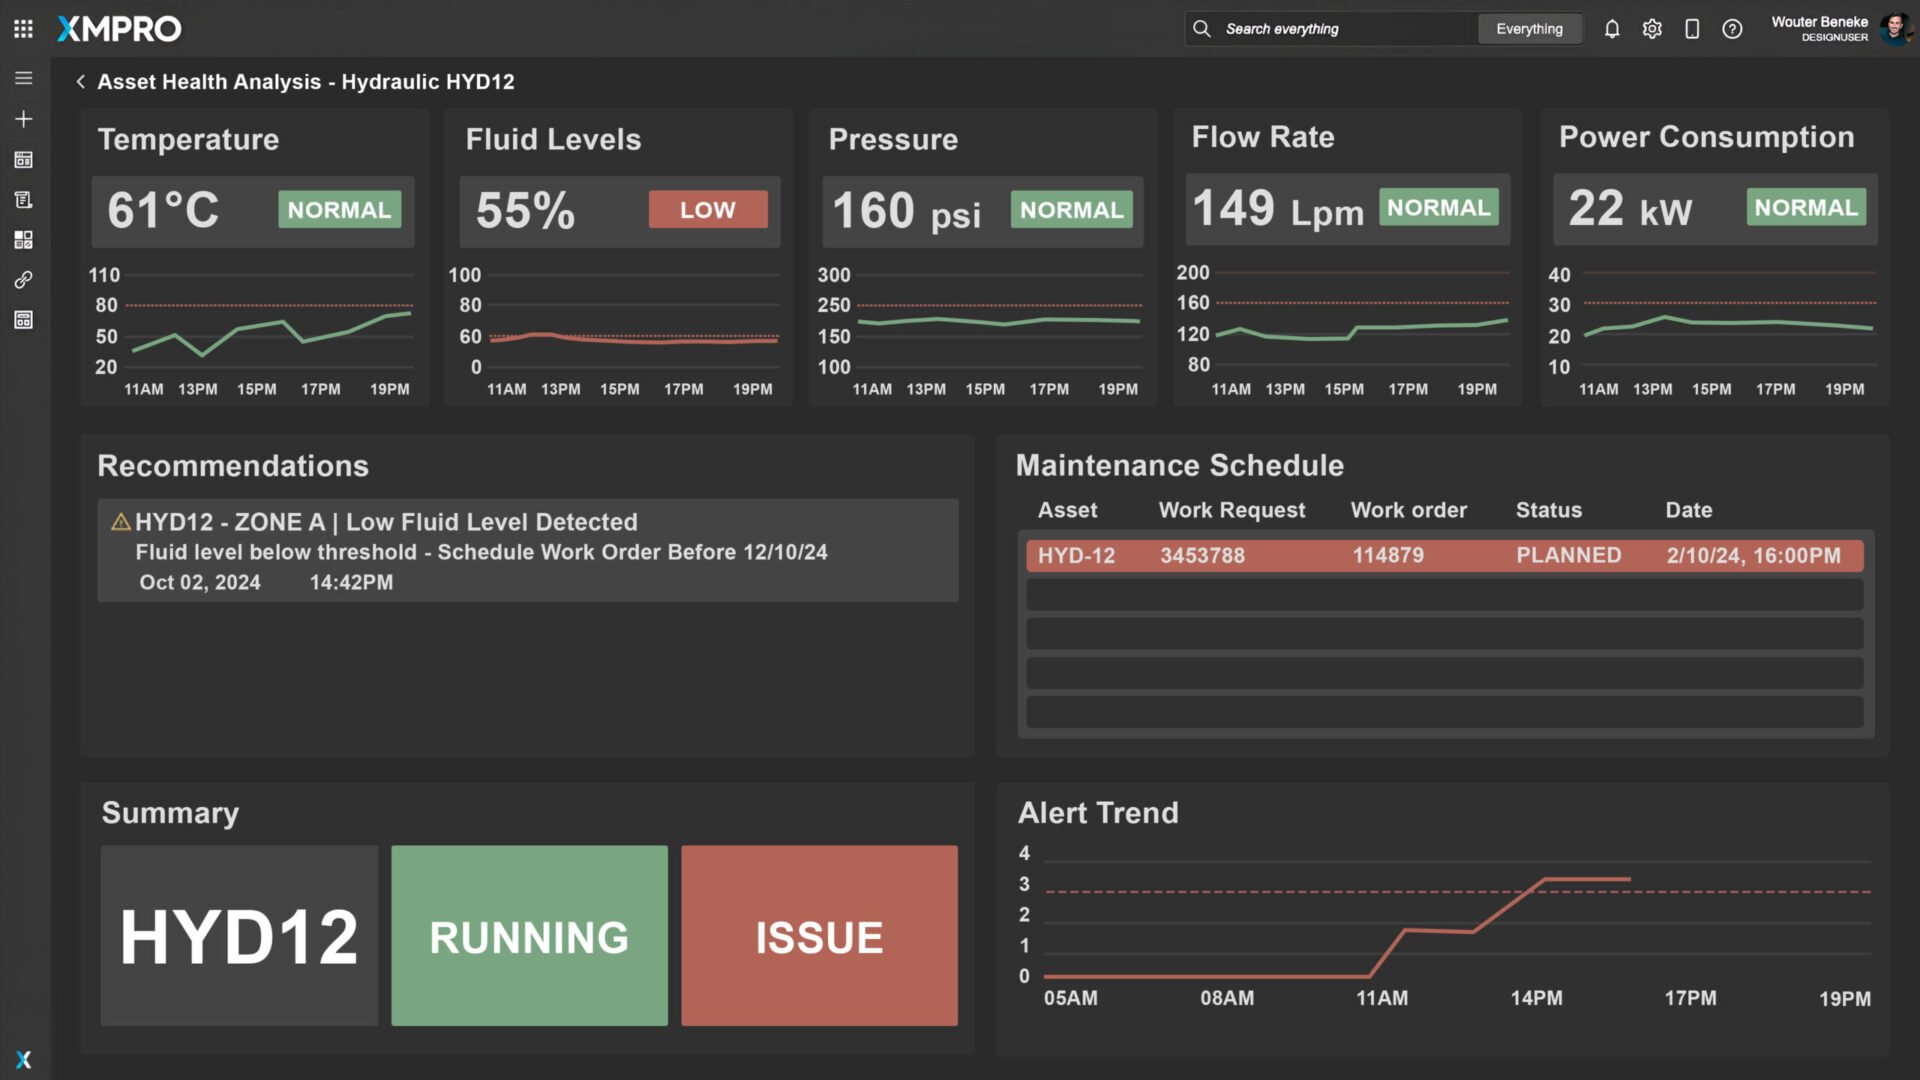
Figure 2. Individual Hydraulic System Condition Monitoring Dashboard
The Hydraulic System Condition Monitoring dashboard offers a detailed, real-time view of key operational parameters for a specific hydraulic system, highlighting critical issues that require immediate attention. This focused dashboard allows for in-depth monitoring and provides actionable insights to ensure system reliability.
Dashboard Features
Key Dashboard Features:
- Critical Condition Alerts: The dashboard identifies critical issues, such as low hydraulic fluid levels and abnormal pressure readings, visually flagged to prompt immediate action. The current state of HYD12 is classified as 'Running' but marked with 'Critical' status due to detected anomalies.
- Key Operational Metrics: Metrics such as fluid level, pressure, temperature, and flow rate are monitored in real time. While temperature and flow rate remain within normal ranges, fluid level and pressure are flagged with critical issues, indicating potential risks of operational inefficiencies or failures.
- Recommendations and Work Orders: The system has detected a low fluid level anomaly in HYD12 located in Zone A, recommending immediate scheduling of a work order to prevent potential system failure. The recommendation is time-stamped to ensure timely interventions and avoid unnecessary delays.
- Maintenance Schedule and Tracking: The planned maintenance for HYD12 is clearly displayed, with work requests and orders aligned with detected issues. This ensures that both scheduled and unscheduled maintenance activities can be tracked and managed efficiently, minimizing operational disruptions.
- Historical Alert Trend: The alert trend graph shows a history of alerts over the past day, giving insights into the frequency and types of issues encountered. This helps maintenance teams predict and prevent future breakdowns by identifying recurring issues and addressing them proactively.
This condition monitoring view provides facility managers and maintenance teams with the critical data needed to manage hydraulic system health effectively, minimize downtime, and address operational issues before they escalate into major failures.
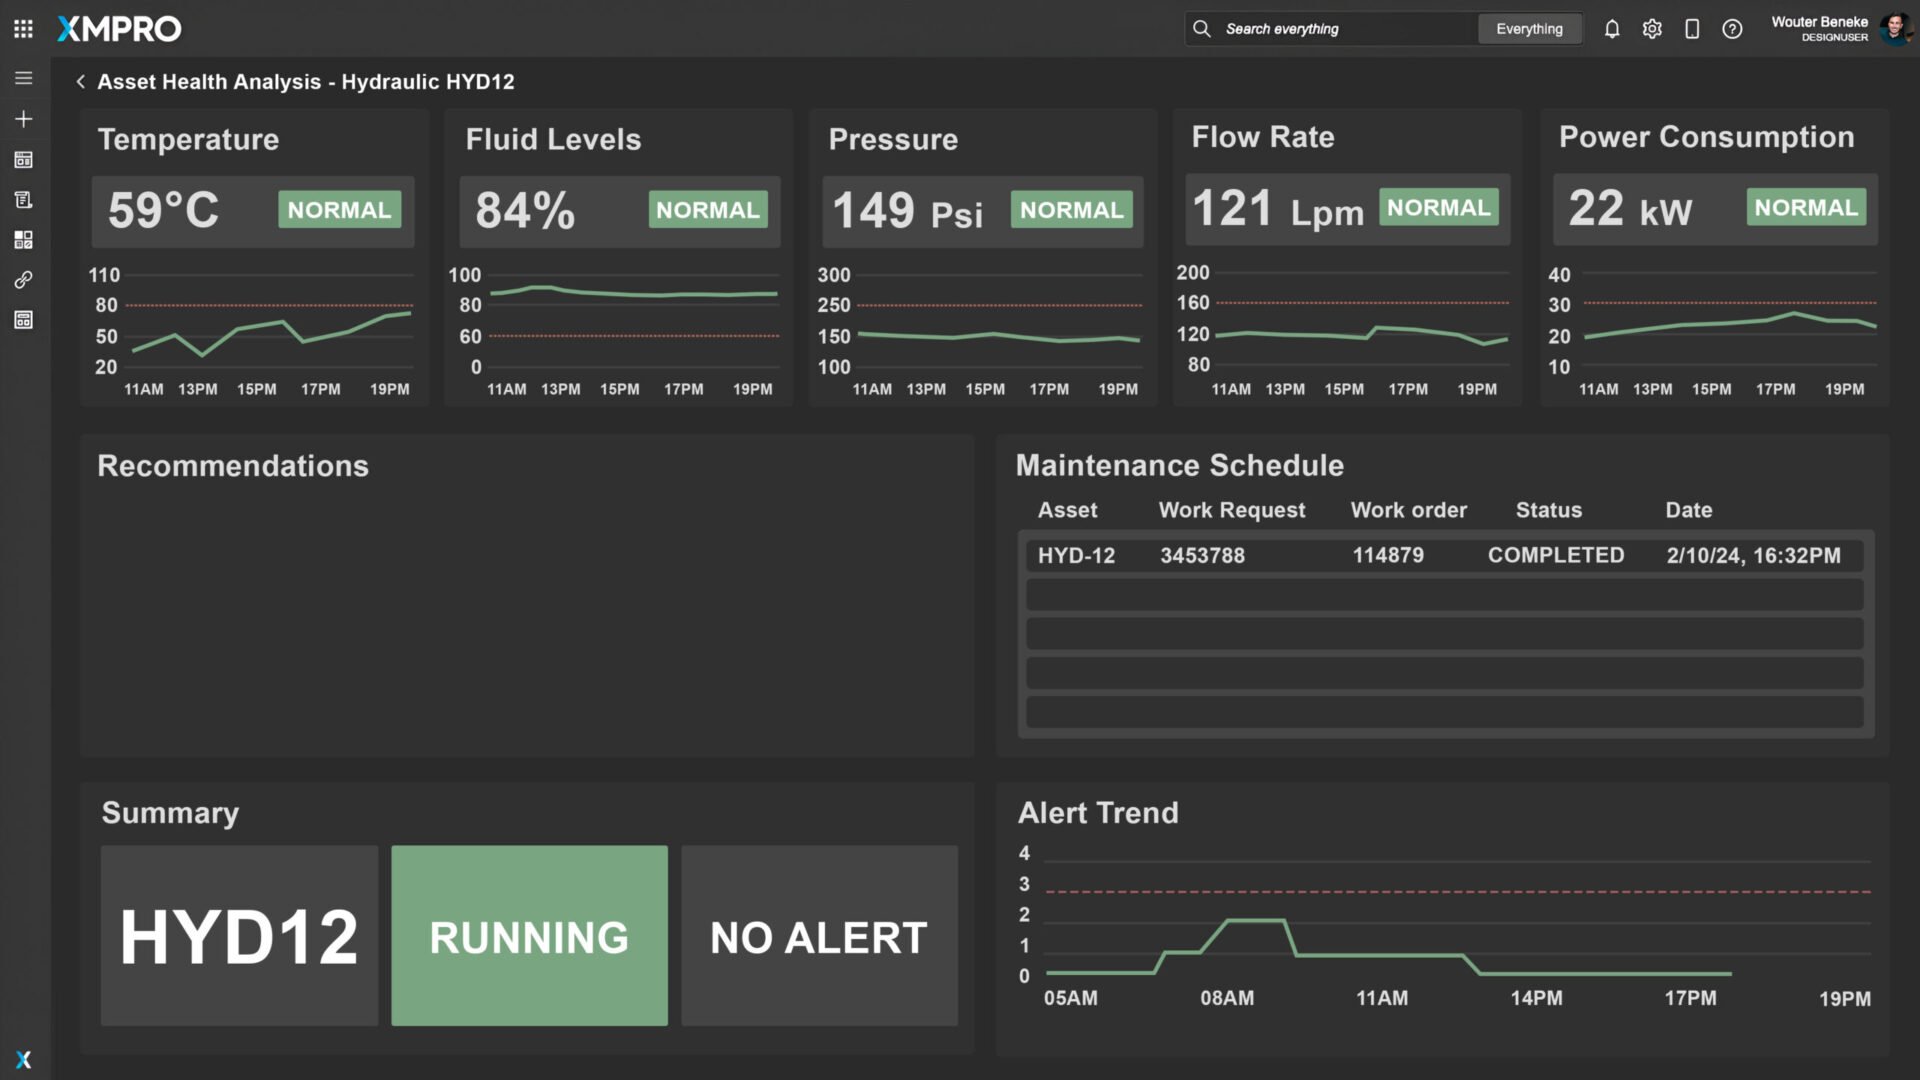
Figure 3. Hydraulic System Condition Monitoring Dashboard - Normal Operations
The Hydraulic System Condition Monitoring dashboard provides a real-time snapshot of a hydraulic system operating under normal conditions. This view allows operators to confirm that all key metrics, such as fluid levels, pressure, and temperature, are within acceptable ranges, ensuring optimal system performance without any issues.
Dashboard Features
Key Dashboard Features:
- Normal Operating Conditions: All critical metrics—fluid level, pressure, temperature, and flow rate—are displayed as normal. This indicates that the hydraulic system is functioning efficiently, with no anomalies or alerts detected.
- Maintenance Completed: The maintenance schedule shows that recent maintenance work has been completed for HYD12, with the work order marked as 'Done'. This ensures that the hydraulic system is fully operational following its service, with no outstanding tasks.
- No Alerts or Recommendations: In this state, no alerts or recommendations are required, confirming that the system is running smoothly. The absence of alerts reassures the maintenance team that the hydraulic system is in optimal condition.
- Performance Trend Monitoring: The alert trend graph reflects a stable history with no significant fluctuations, further supporting the healthy operational state of the hydraulic system.
This dashboard provides facility managers with confidence that Hydraulic System HYD12 is operating as expected, without any interruptions or the need for immediate maintenance actions, allowing them to focus on other operational priorities.

XMPro AI (Optional)
Experience the transformative power of XMPro’s Intelligent Business Operations Suite (iBOS) – Featuring comprehensive AI capabilities, XMPro iBOS helps to significantly increase product yield, drastically reduce downtime, and ultimately eliminate unexpected business events.Why XMPro iBOS for Hydraulic System Monitoring
XMPro’s Intelligent Business Operations Suite (iBOS) is specifically engineered to address the complexities of monitoring and optimizing hydraulic systems in the manufacturing industry. By providing a comprehensive, predictive, and integrated management solution, XMPro enables manufacturers to optimize hydraulic performance, enhance operational efficiency, and ensure equipment reliability and safety.

Advanced Intelligent Digital Twin Modeling:
XMPro iBOS advances beyond basic modeling, offering sophisticated digital twin creation that reflects the complex nature of manufacturing operations. It provides a dynamic virtual representation of physical assets for in-depth analysis and scenario planning.
Advanced Sensor Data Integration & Transformation:
Incorporating live data from sensors on all hydraulic equipment, XMPro iBOS tracks essential metrics and data. This comprehensive monitoring detects and analyzes opportunities for performance enhancement across the plant.
Predictive Analytics for Performance Enhancement:
Employing predictive analytics to anticipate issues and optimize operational segments, reducing waste and enhancing system reliability.
Maintenance Scheduling Optimization:
XMPro shifts from reactive to predictive maintenance, allowing tasks to be scheduled at optimal times without disrupting production, ultimately extending the lifespan of hydraulic systems..
Real-Time Monitoring and Predictive Alerting:
Automatic alerts based on data analysis ensure that operators are informed the moment a hydraulic system's performance dips below acceptable levels. XMPro generates actionable recommendations in real time.
Configurable and Interactive Dashboards:
XMPro offers configurable dashboards that allow operators to quickly assess hydraulic system health and drill down into specific metrics. These dashboards are ideal for both operations managers and technicians, providing immediate insights and centralizing decision-making.
Scalability and Flexibility – Start Small, Scale Fast:
Whether monitoring a small number of hydraulic systems or expanding to cover more critical assets, XMPro’s iBOS is designed to scale seamlessly, supporting your growth and evolving requirements.
Enhanced Safety & Operational Efficiency:
XMPro’s real-time monitoring helps ensure hydraulic systems operate within safe limits, minimizing the risk of accidents and enhancing operational efficiency. This leads to safer work environments and more reliable production processes.
XMPro Blueprints - Quick Time to Value:
XMPro Blueprints enable fast implementation of battery operations solutions, with templates based on industry best practices for rapid benefits realization. These blueprints ensure swift adoption of digital advancements across manufacturing operations.
XMPro iBOS is specifically designed to address the challenges of hydraulic system condition monitoring in manufacturing environments, providing a comprehensive, predictive, and integrated management solution. Its advanced operational modeling, powerful data analytics, and customized dashboards enable manufacturers to optimize system performance, enhance operational efficiency, and ensure equipment reliability and safety.
Not Sure How To Get Started?
No matter where you are on your digital transformation journey, the expert team at XMPro can help guide you every step of the way - We have helped clients successfully implement and deploy projects with Over 10x ROI in only a matter of weeks!
Request a free online consultation for your business problem.
"*" indicates required fields