


Documentation
Get detailed guidance on platform features
In the renewable energy sector, optimizing the performance of wind turbines is crucial for maximizing energy output and efficiency. XMPro’s solution for Wind Turbine Performance Optimization leverages advanced data analytics and intelligent digital twin technology to enhance the operational efficiency of wind turbines.

Wind turbines operate under varying environmental conditions, which can significantly impact their efficiency and energy output. Key challenges involve:
Optimizing Turbine Performance: Adjusting turbine operations to maximize energy output under different wind conditions.
Reducing Wear and Tear: Minimizing unnecessary stress on turbine components to extend their lifespan.
Maximizing Energy Yield: Ensuring turbines operate at peak efficiency to maximize the energy yield.
Our solution features real-time data monitoring through IoT sensors, predictive analytics for optimal turbine settings, and digital twin modeling for performance simulations. Automated recommendations help adjust turbine settings for maximum efficiency, while customizable dashboards provide operators with key performance metrics for informed decision-making.
Real-Time Data Monitoring:
Utilizing IoT sensors to continuously monitor wind speed, direction, turbine rotation speed, and other critical parameters.
Predictive Analytics for Performance Tuning:
Analyzing sensor data with advanced algorithms to predict optimal turbine settings for different wind conditions.
Digital Twin Modeling:
Creating digital twins of wind turbines to simulate and analyze performance under various scenarios, aiding in decision-making for performance optimization.
Automated Adjustment Recommendations:
Providing automated recommendations for adjusting turbine settings such as blade pitch and rotation speed to optimize performance and energy output.
Customizable Dashboards and Reporting:
Offering customizable dashboards that display key performance metrics, enabling operators to monitor turbine efficiency and make informed decisions.


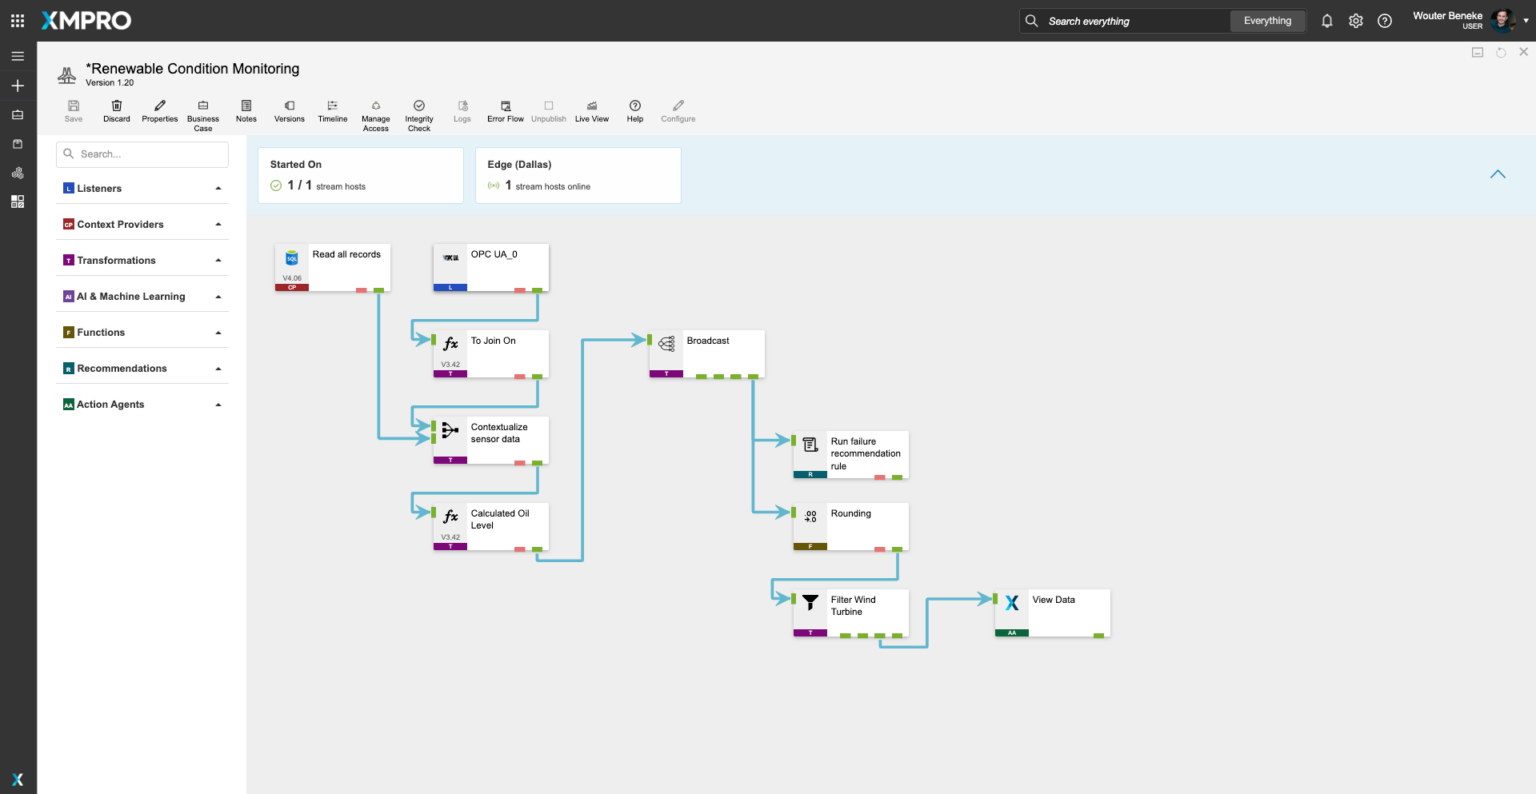
XMPRO’s Data Stream Designer lets you visually design the data flow and orchestration for your real-time applications. Our drag & drop connectors make it easy to bring in real-time data from a variety of sources, add contextual data from systems like EAM, apply native and third-party analytics and initiate actions based on events in your data.
Figure 1. Wind Turbine Condition Monitoring Data Stream
This renewable condition monitoring data stream for a wind turbine begins by reading all records from various data sources, including an OPC UA server. The data is then joined and contextualized with sensor data to provide a comprehensive view. Calculated metrics, such as oil levels, are derived from the sensor data. The processed data is broadcasted to multiple endpoints for further analysis. A failure recommendation rule is applied to identify potential issues, and the data is rounded and filtered specifically for wind turbines. The final processed data is then made available for viewing and further action through a visualization platform, ensuring continuous monitoring and proactive maintenance of the wind turbine.
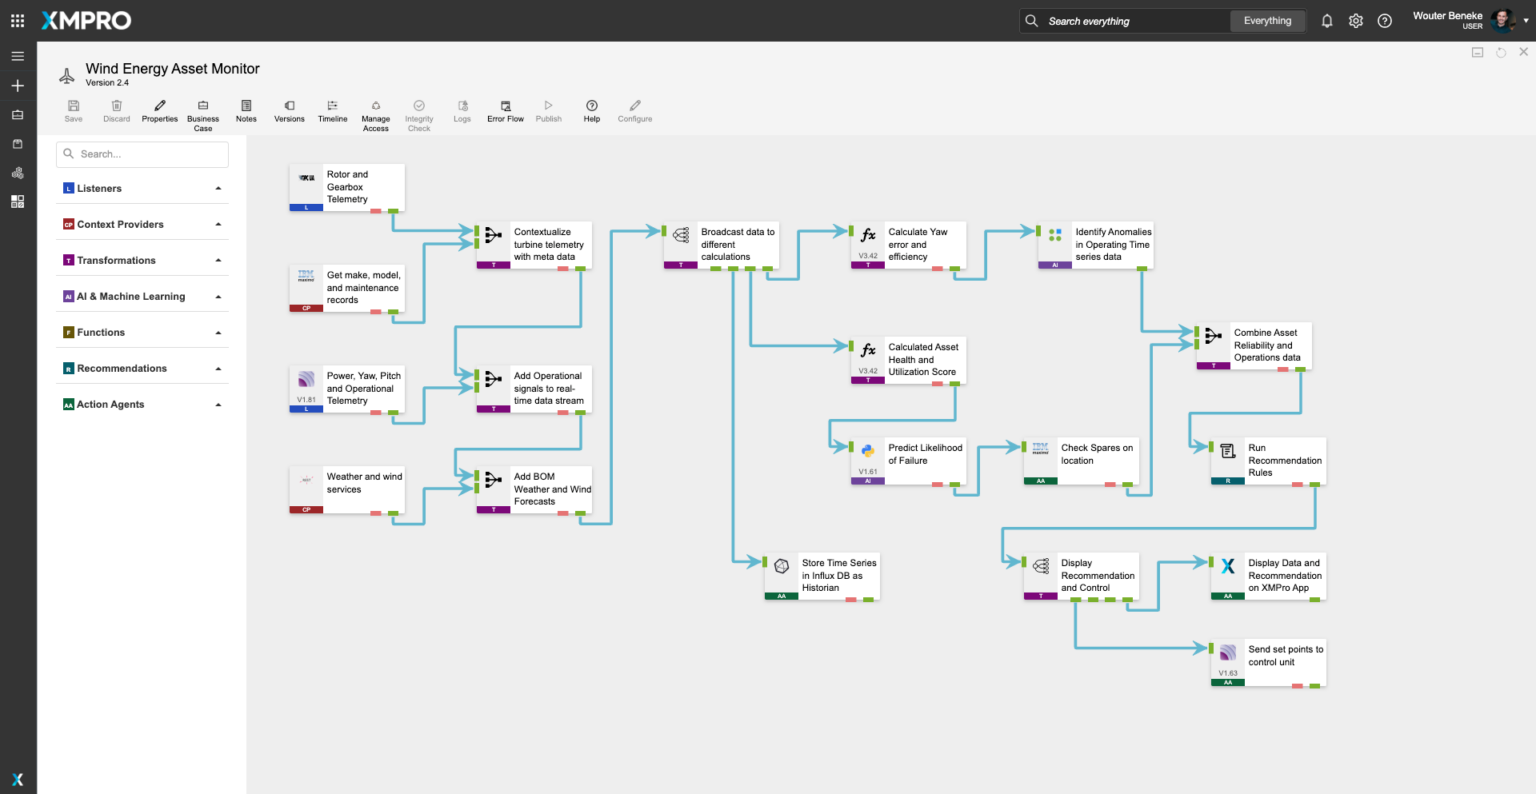
Figure 2. Wind Energy Asset Data Stream
This wind energy asset monitoring data stream collects and processes telemetry data from various sources, including rotor and gearbox, power, yaw, pitch, operational telemetry, and weather and wind services. The data is contextualized with metadata and operational signals, then broadcasted for different calculations. Calculations include yaw error and efficiency, asset health and utilization scores, and predicting the likelihood of failure. Anomalies in operating time series data are identified, and asset reliability and operations data are combined. The system checks spares on location, runs recommendation rules, and stores time series data in an InfluxDB historian. Recommendations and control data are displayed on the XMPro app, and set points are sent to the control unit, ensuring comprehensive monitoring and proactive maintenance of wind energy assets.
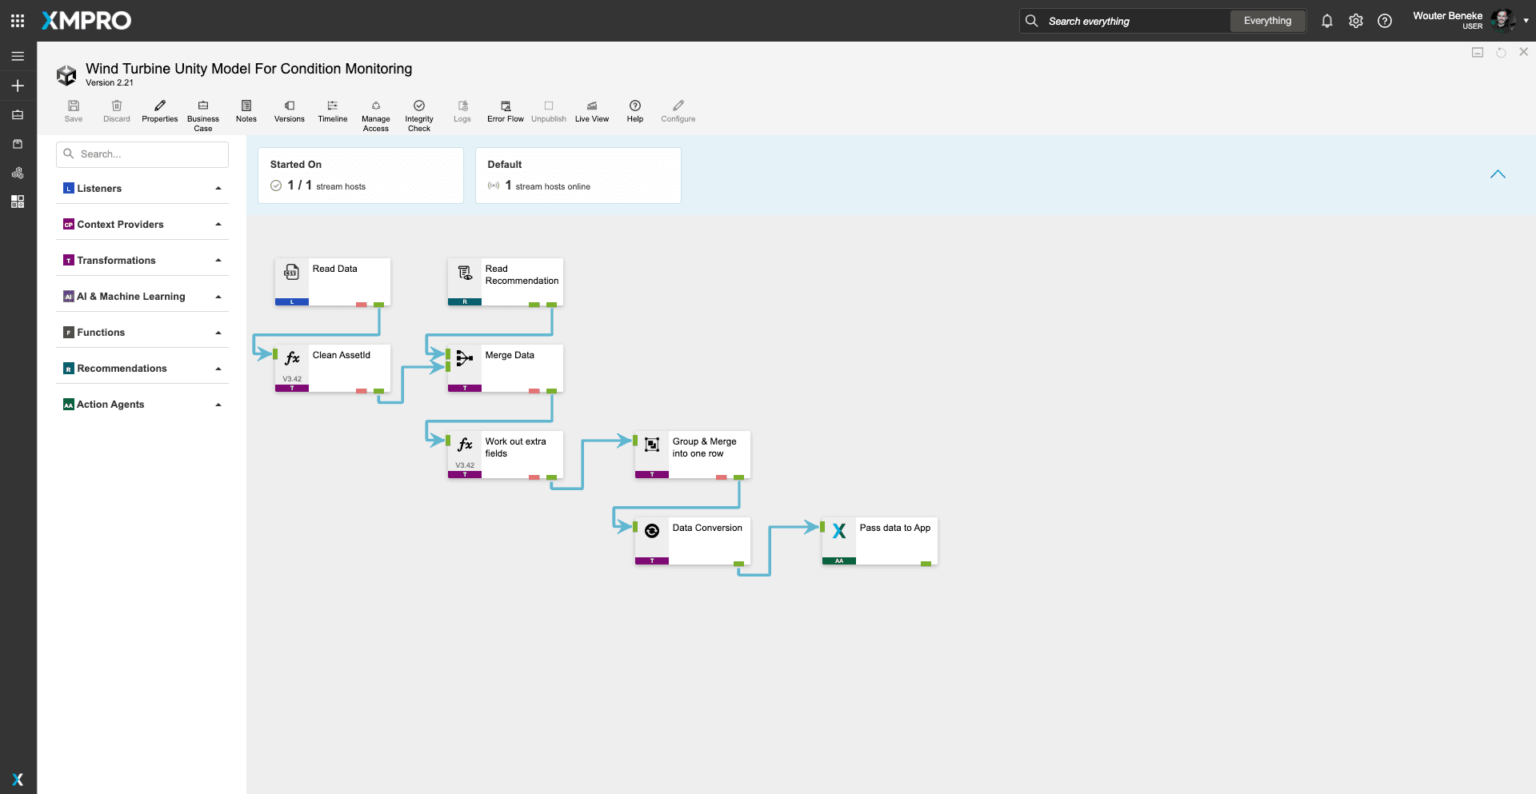
Figure 3: Wind Turbine Unity Model For Condition Monitoring
This pump predictive maintenance data stream ingests pressure, flow, temperature, vibration, and sensor health data from multiple sources before it is normalized and combined with contextual data from SAP and Azure Digital Twin. The integrated data is then used to calculate performance metrics, run predictive models, and update Azure Digital Twin and ADX, enabling the identification of pumps likely to fail and the estimation of their remaining useful life.

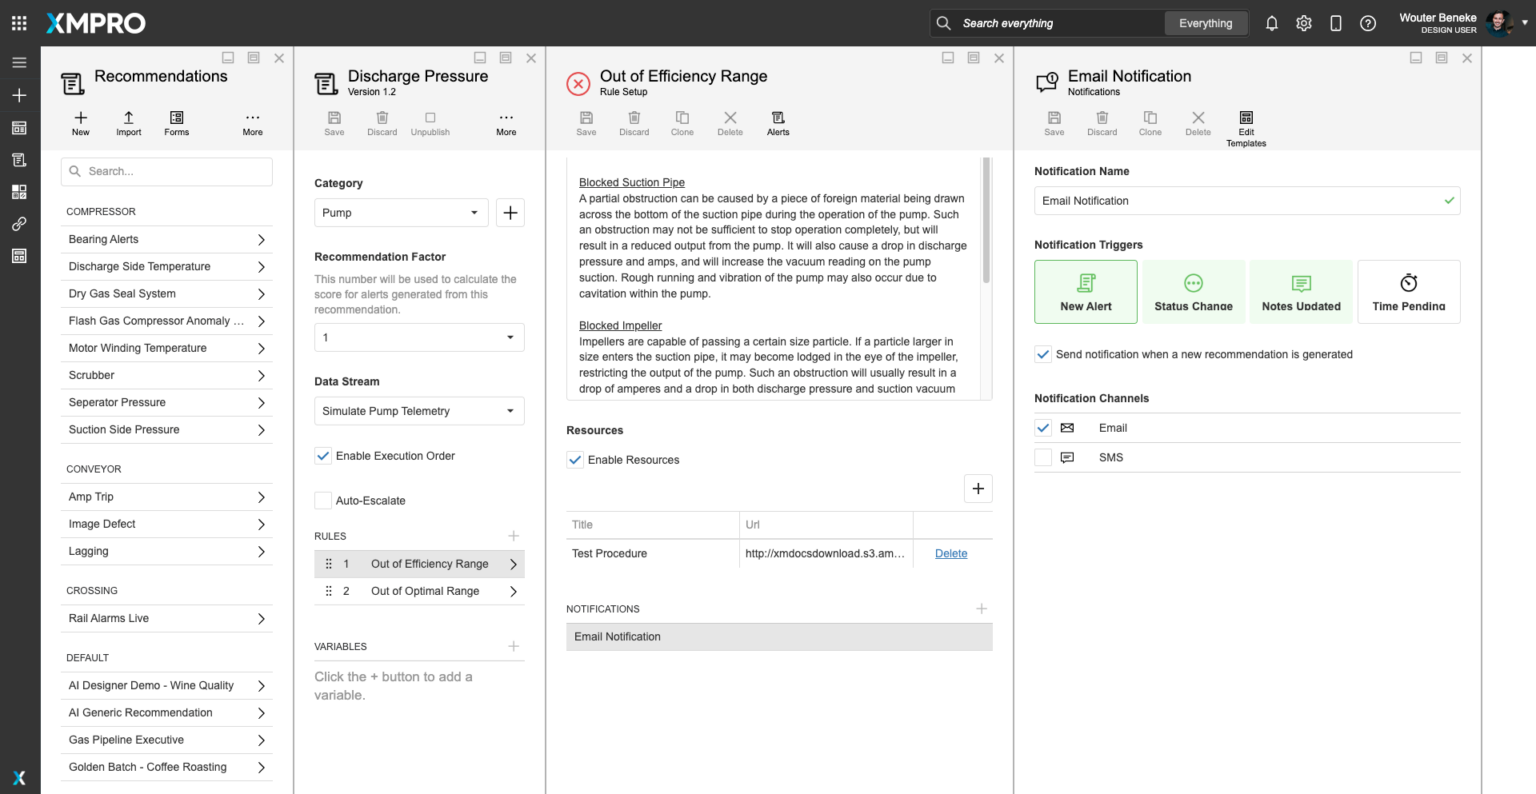
XMPRO Recommendations are advanced event alerts that combine alerts, actions, and monitoring. You can create recommendations based on business rules and AI logic to recommend the best next actions to take when a certain event happens. You can also monitor the actions against the outcomes they create to continuously improve your decision-making.
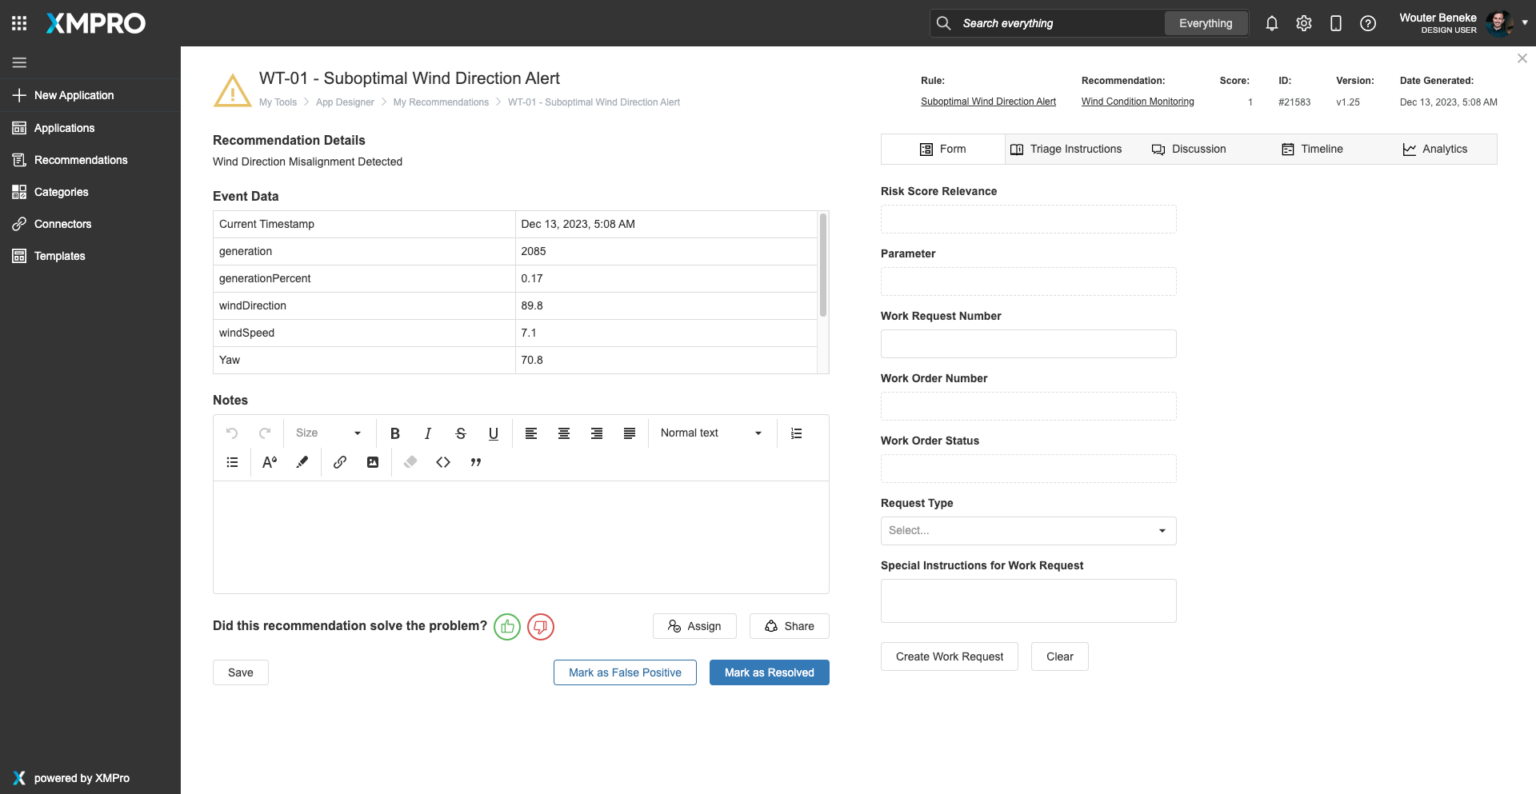
Figure 1. Sub-Optimal Wind Direction Recommendation
This recommendation for wind turbine WT-01 identifies a suboptimal wind direction, indicating a misalignment detected in wind direction. The event data includes the current timestamp, power generation (2085 units), generation percentage (0.17%), wind direction (89.8 degrees), wind speed (7.1 m/s), and yaw (70.8 degrees). Users can add notes, assign the recommendation, share it, and create a work request with special instructions. The system tracks whether the recommendation solved the problem and provides options to mark it as a false positive or resolved. This setup ensures prompt response to wind direction misalignment issues, optimizing turbine performance and efficiency.
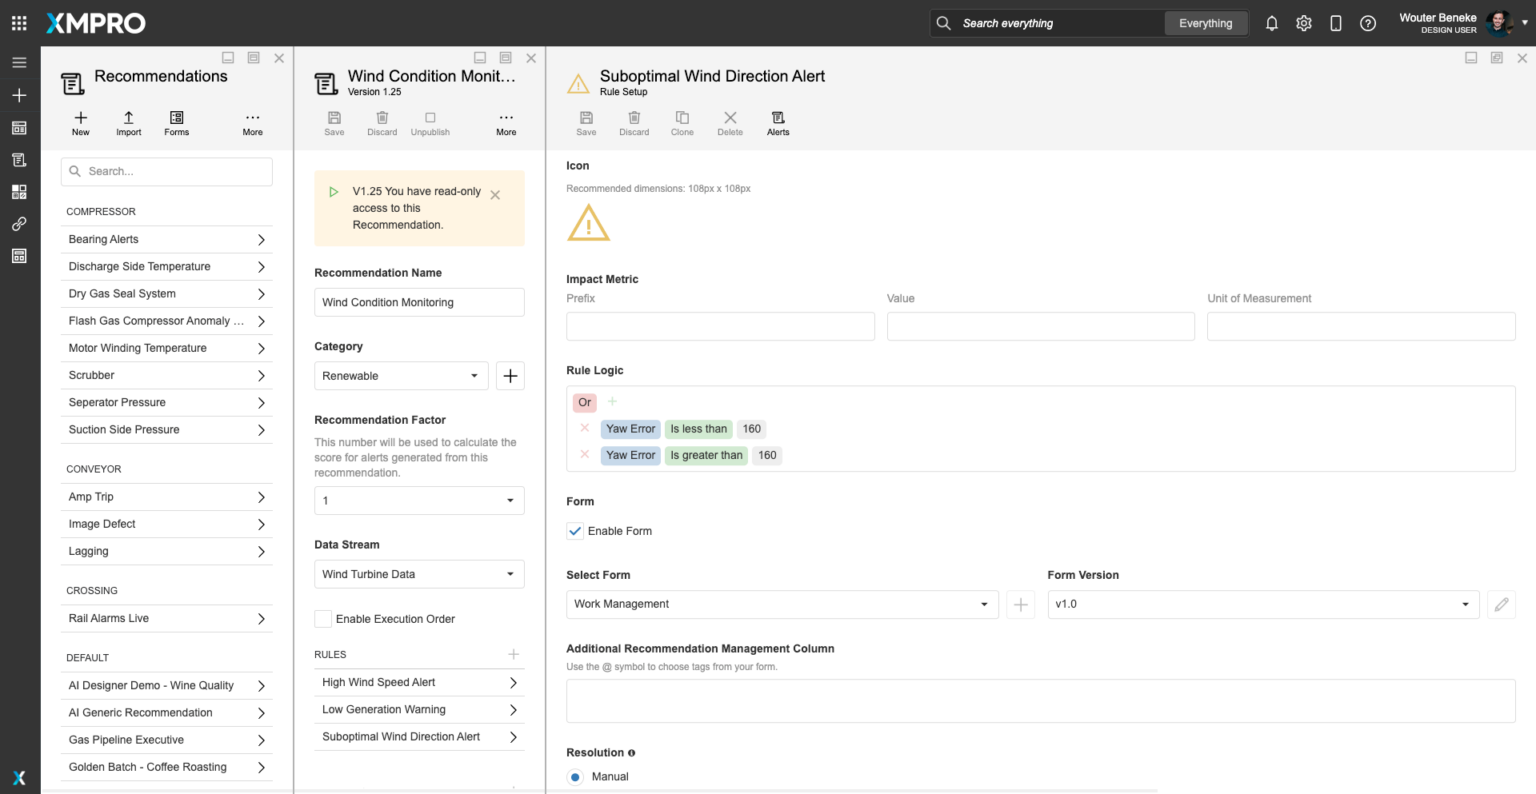
Figure 2. Configure With Granular Rule Logic
This suboptimal wind direction alert configuration allows users to set up granular rule logic for monitoring wind turbine conditions. The interface enables selecting metrics such as yaw error and setting specific thresholds to trigger alerts. Users can categorize recommendations, enable execution order, and auto-escalate critical issues.
Figure 3. Close The Loop On Event Response
Closing the loop on event response, the system can take various actions, including sending email and SMS notifications for new recommendations, status changes, note updates, and pending times. Additionally, it can automatically create work orders, send information to ERPs, and execute other predefined actions, ensuring comprehensive monitoring and immediate response to pump issues with detailed guidance and timely alerts.
The XMPro App Designer is a no code event intelligence application development platform. It enables Subject Matter Experts (SMEs) to create and deploy real-time intelligent digital twins without programming. This means that SMEs can build apps in days or weeks without further overloading IT, enabling your organization to accelerate and scale your digital transformation.
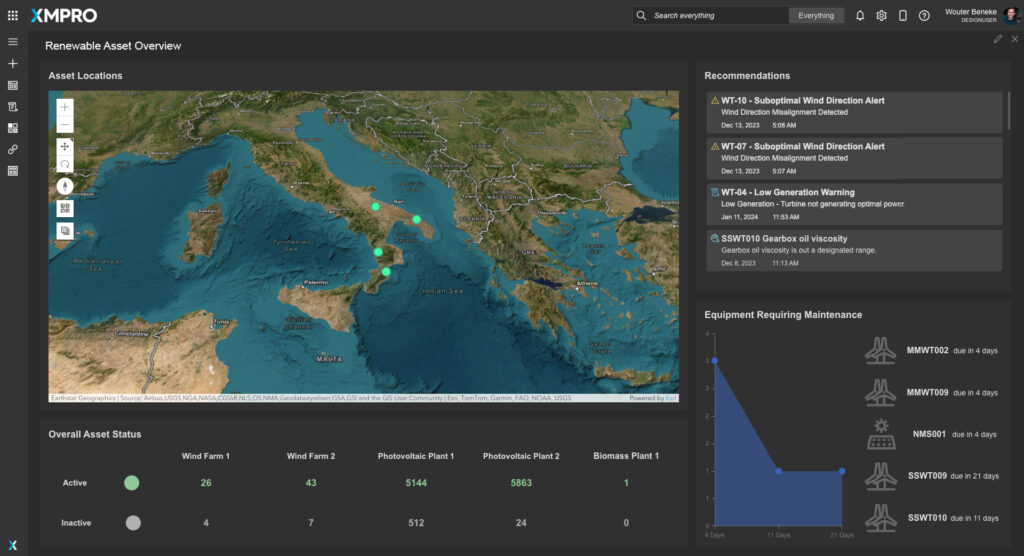
Figure 1. Real-Time Renewable Asset Overview Dashboard for Wind and Solar Farms
This advanced dashboard is specifically designed for operators of wind farms, providing a comprehensive view of wind turbine performance and optimization. It features an interactive map that dynamically updates with the operational status of different wind farms, offering a clear visual representation of their performance efficiency and health. Each wind farm on the map is marked with a color-coded status icon, indicating its current operational state, including active status and any alerts or error messages related to performance optimization or maintenance needs of individual turbines within that wind farm.
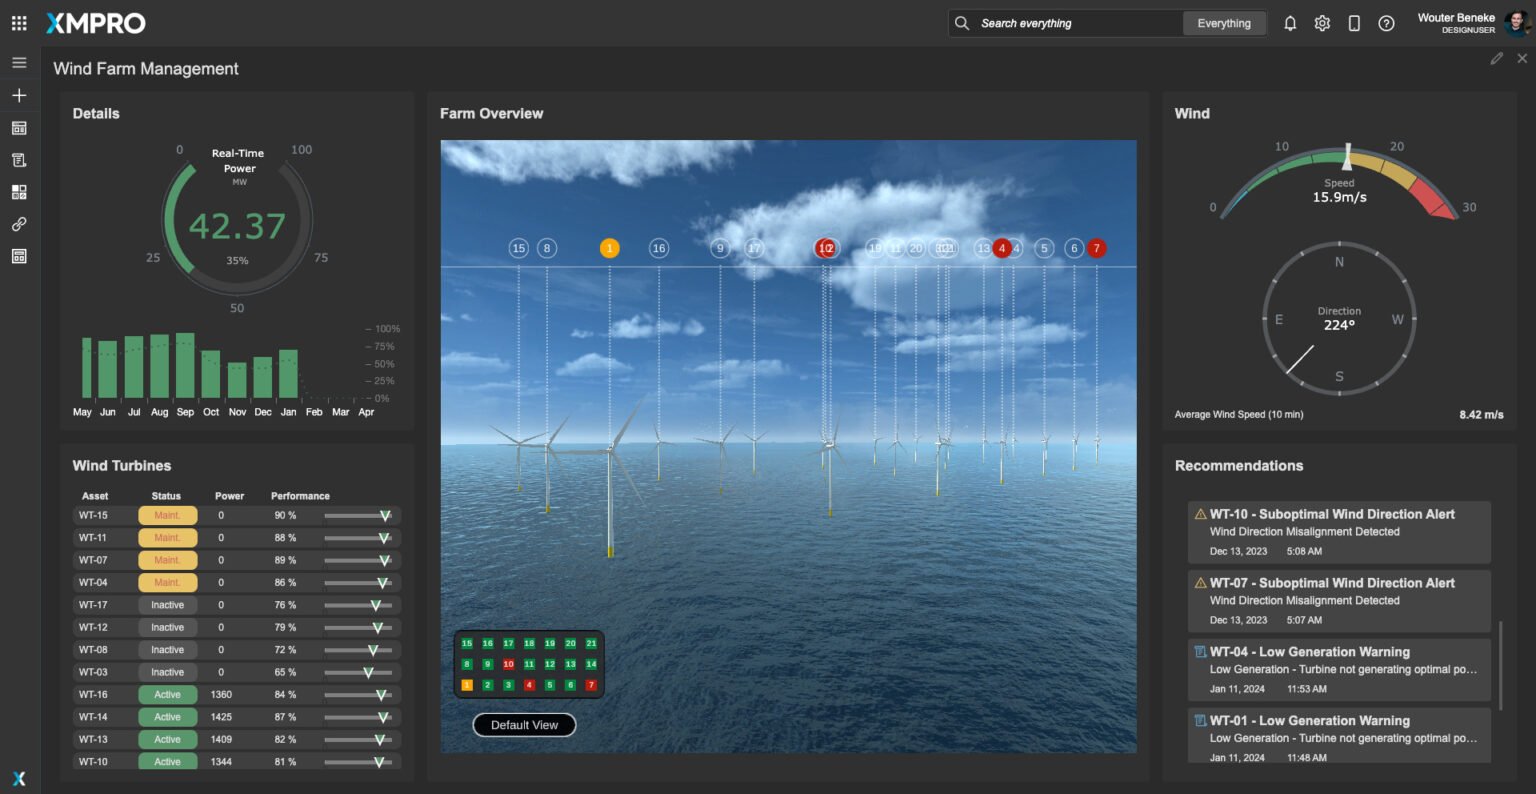
Figure 2a. Real-Time Wind Farm Performance Management View
This XMPro digital dashboard, designed for Wind Farm Management, equips operators with essential tools for optimizing turbine operations and enhancing overall efficiency.
Immediate Energy Output Assessment:
The real-time power gauge showing current power generation in megawatts (MW) is crucial for assessing the farm’s immediate energy output. This feature allows operators to quickly identify any deviations from expected performance levels, which is key to maintaining optimal energy production.
Long-Term Performance Analysis:
The historical power chart displaying monthly power output data enables operators to analyze long-term performance trends. This insight is vital for strategic planning, identifying underperformance periods, and making informed decisions about maintenance and operational adjustments. Data Range: Monthly data from May to April.
Targeted Turbine Maintenance and Optimization:
The status table for individual wind turbines provides detailed information on each turbine’s status, power output, and performance. This targeted approach helps in pinpointing turbines that require maintenance or optimization, directly influencing the overall efficiency and reliability of the wind farm. Details: Asset name, status, power output, and performance percentage.
Visual Management of Wind Farm Operations:
The farm overview visualization offers a geographical representation of the wind farm, with clear indicators for each turbine’s status. This visual management tool is essential for large-scale operations, enabling quick identification and prioritization of turbines for performance optimization or maintenance.
Optimization Based on Wind Conditions:
The wind details section, showing real-time wind speed and direction, is critical for adjusting turbine operations to maximize energy capture. This real-time data ensures turbines are optimally aligned with current wind conditions, enhancing energy production efficiency. Metrics: Wind speed (m/s) and direction (degrees).
Proactive Maintenance and Performance Alerts:
The dashboard’s recommendations and alerts section provides actionable insights for proactive maintenance and performance optimization. These alerts address issues that can significantly impact energy output, ensuring timely interventions for optimal turbine performance.
Enhanced Operational Efficiency and User Experience:
The user-friendly interface with easy navigation and quick access to various functionalities enhances operational efficiency. This feature allows operators to manage complex wind farm operations effectively, ensuring optimal performance and maintenance scheduling. The Real-Time Wind Farm Performance Management Dashboard is a comprehensive tool that provides wind farm operators with the necessary data and insights for optimizing turbine performance and overall wind farm efficiency. Its combination of real-time monitoring, historical analysis, and actionable recommendations plays a crucial role in enhancing the operational efficiency and energy output of wind farms.
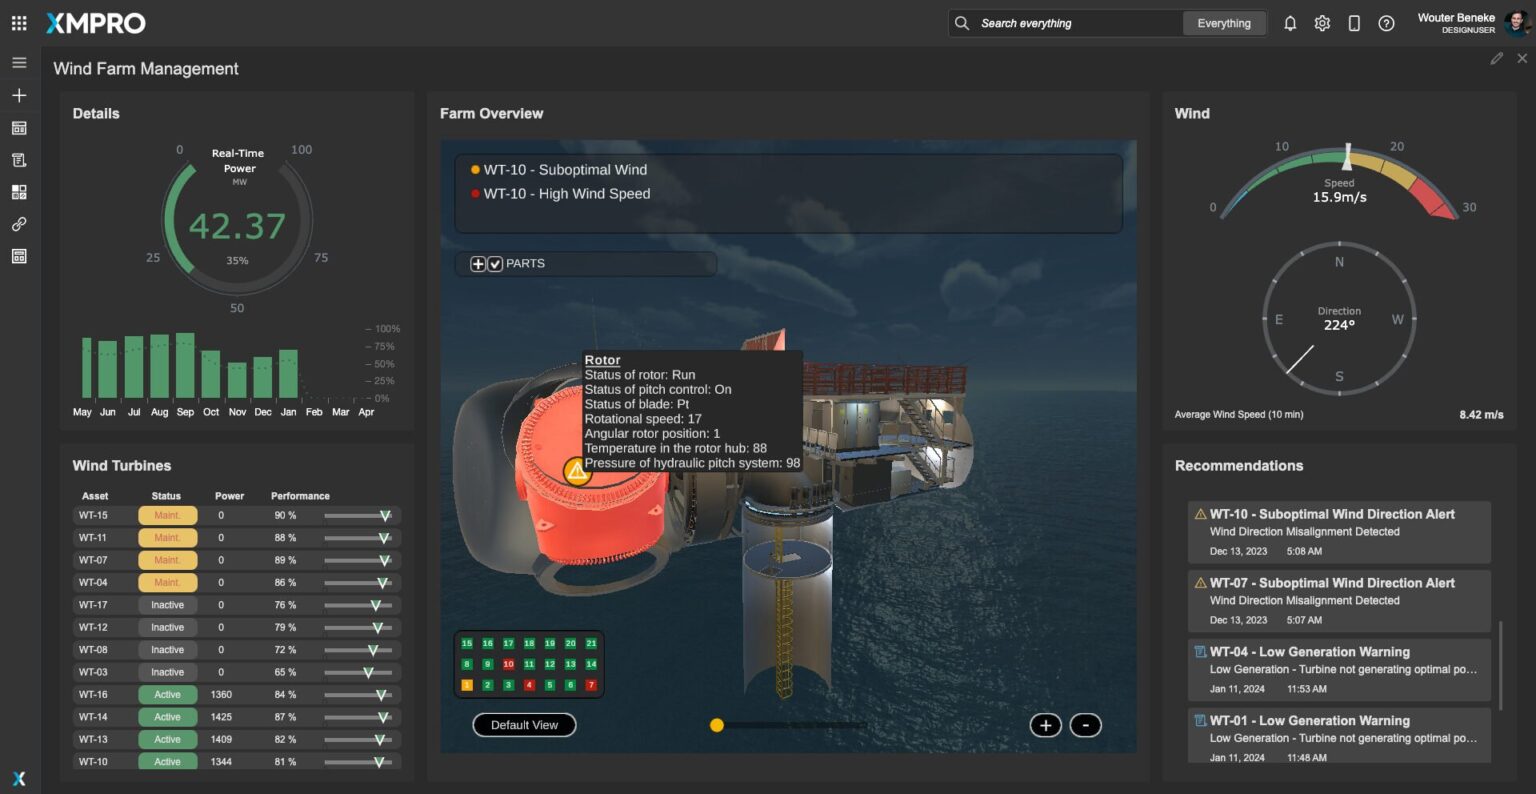
Figure 2.b Real-Time Wind Farm Performance Management View – Individual Wind Turbine
This XMPro dashboard view provides a detailed perspective on individual wind turbines within a wind farm, enhancing the ability to monitor and optimize each turbine’s performance.
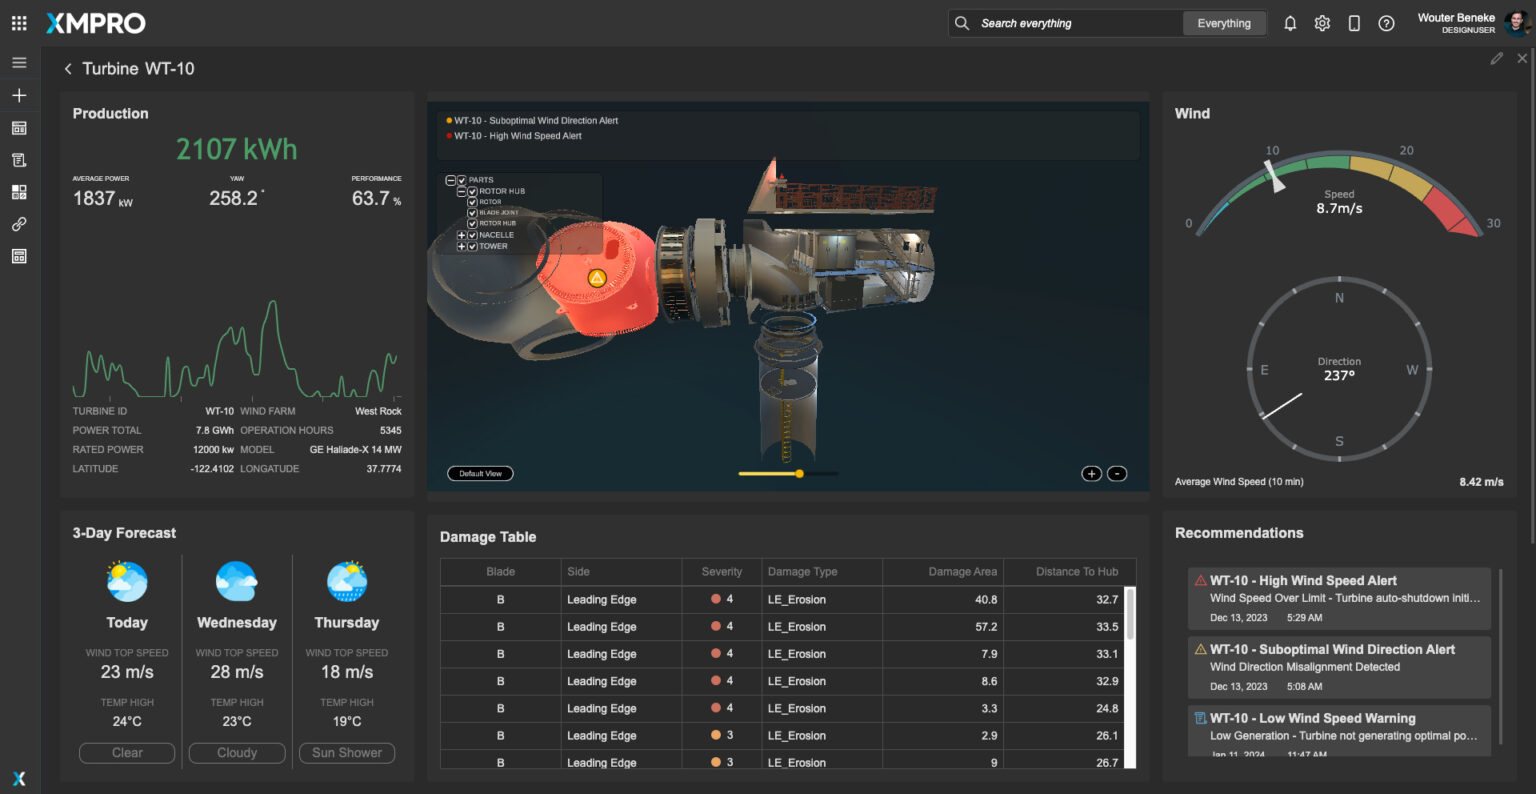
Figure 3. Asset Analysis View – Wind Turbine WT-10 Health
This Asset Analysis View on the XMPro dashboard offers detailed insights into a specific wind turbine within a renewable energy system, focusing on turbine WT-10.
Comprehensive Production and Performance Data:
The left section of the dashboard displays crucial production data for WT-10, including kilowatt-hours (2107 kWh), average power (1837 kW), and performance (63.7%). A green line graph illustrates the power output fluctuation over time, providing a visual representation of the turbine’s energy production efficiency. This data is essential for assessing the turbine’s current output and identifying trends or deviations in performance.
Detailed Turbine Information:
Below the production data, detailed information about WT-10 is listed, including turbine ID, wind farm location (West Rock), total power generated (7.8 GWh), operational hours (5345), and the turbine model (GE Haliade-X 14 MW). Geographical coordinates are also provided. This comprehensive profile is vital for understanding the turbine’s operational context and history, aiding in maintenance planning and performance analysis.
Weather Forecast for Operational Planning:
A 3-day weather forecast presents predictions for wind top speed and temperature highs, along with expected weather conditions. This forecast is crucial for anticipating environmental factors that could impact turbine performance and planning appropriate operational responses.
Blade Damage Analysis:
A detailed table outlines the damage to the turbine’s blades, including blade side, severity, damage type (LE Erosion), and the affected area in square meters. This information is critical for prioritizing maintenance activities and addressing blade health, which directly impacts turbine efficiency.
Interactive 3D Turbine Visualization:
The central 3D visualization of WT-10 highlights different parts, such as the rotor hub, and shows an alert symbol indicating issues. This interactive model allows for a deeper understanding of the turbine’s condition and aids in identifying areas requiring attention.
Wind Speed and Direction Monitoring:
On the right, a gauge displays the current wind speed (8.7 m/s) and direction (237°), along with an average wind speed indicator. Monitoring these conditions is essential for optimizing turbine alignment and settings to maximize energy capture.
Targeted Recommendations and Alerts:
Below the wind details, specific recommendations and alerts for WT-10 are listed, including high wind speed, suboptimal wind direction, and low wind speed warnings. These alerts, complete with timestamps, are key for proactive maintenance and operational adjustments.
User Interface and Navigation:
The dashboard includes a search function, user profile, and other interface icons for easy navigation and settings adjustments. This enhances the user experience, allowing for efficient management of turbine data and settings.
This Asset Analysis View for Wind Turbine WT-10 on the XMPro dashboard provides a specialized and comprehensive analysis of the turbine’s performance, condition, and environmental factors. It is an invaluable tool for maintenance planning, operational decision-making, and optimizing the turbine’s energy output and efficiency.

Experience the transformative power of XMPro’s Intelligent Business Operations Suite (iBOS) – Featuring comprehensive AI capabilities, XMPro iBOS helps to significantly increase product yield, drastically reduce downtime, and ultimately eliminate unexpected business events.
XMPro’s Intelligent Digital Twin Suite (iDTS) offers several unique solutions for optimizing the performance of wind turbines, particularly in the context of the Wind Turbine Performance Optimization use case. Here’s how XMPro iDTS effectively addresses this challenge:

XMPro iDTS creates sophisticated digital twins of individual wind turbines, providing a virtual representation that mirrors their real-world conditions. This enables detailed analysis and simulation of turbine performance under various environmental and operational scenarios.
The suite integrates real-time data from various sensors on the wind turbines, such as wind speed, direction, temperature, and turbine operational metrics. This integration allows for comprehensive monitoring and analysis of turbine performance, identifying areas for optimization.

Utilizing advanced predictive analytics, XMPro iDTS can forecast potential performance issues and identify optimal operational settings for each turbine. This predictive approach enables proactive adjustments to maximize efficiency and energy output.

By analyzing performance data, XMPro iDTS helps optimize maintenance schedules, shifting from a reactive to a predictive maintenance approach. This reduces downtime and extends the lifespan of turbine components.

The platform can generate automated recommendations for adjusting turbine settings, such as blade pitch or rotation speed, based on real-time data and predictive insights. This automation ensures turbines operate at their peak efficiency.
XMPro iDTS features customizable dashboards that provide real-time insights into turbine performance. These dashboards are interactive, allowing operators to drill down into specific aspects of turbine operation, such as power output, rotor speed, and blade health.
XMPro iDTS offers scalable and flexible solutions, allowing wind farms to start small and expand as needed. Its modular design ensures easy integration and adaptability, facilitating quick deployment and future-proof scalability.

he suite enhances operational safety by predicting and mitigating potential risks associated with turbine operation. It also improves overall operational efficiency by ensuring turbines operate within optimal parameters.

XMPro Blueprints offer a rapid path to value realization for wind farms. These pre-configured templates are designed for quick implementation, incorporating best practices and industry standards.
In summary, XMPro iDTS addresses the Wind Turbine Performance Optimization use case by providing a comprehensive, real-time, predictive, and integrated solution. Its capabilities in digital twin technology, advanced data integration, predictive analytics, and interactive dashboards make it a powerful tool for enhancing the performance, safety, and efficiency of wind turbines.
"*" indicates required fields