


Documentation
Get detailed guidance on platform features
XMPro’s Intelligent Business Operations Suite (iBOS) offers a powerful solution for national multi-site optimization in iron ore mining. By integrating data from various mine sites into a comprehensive dashboard, XMPro iBOS provides unparalleled visibility and actionable insights. This real-time event intelligence allows executives to keep their finger on the pulse of their business across all locations in real time. The National Multi-Site Optimization Overview for Iron Ore Mines delivers real-time insights into production performance, efficiency, reliability, and environmental impact, helping mining companies achieve operational excellence and sustainability goals.
Managing multiple iron ore mining sites at a strategic level presents significant challenges that require real-time coordination and comprehensive oversight.
Data Integration and Real-Time Visibility: Mining operations produce vast amounts of data from various stages and locations, making it difficult to integrate this data into a unified view. Without real-time insights, decision-makers face delays in identifying and addressing issues, leading to suboptimal performance and increased risks.
Operational Efficiency: Variability in production rates across different sites complicates the task of maintaining consistent performance and meeting overall targets. Inconsistent throughput disrupts production schedules and complicates resource allocation, making it difficult to sustain a steady workflow.
Cost Management: High operational costs, driven by inefficient processes, excessive fuel consumption, and frequent maintenance, can erode profitability. Ensuring cost-effective operations across multiple sites requires continuous monitoring and optimization of resource use.
Regulatory Compliance and Environmental Impact: Ensuring adherence to environmental and safety regulations across diverse locations is critical. Non-compliance can lead to significant legal repercussions, fines, and damage to the company’s reputation. Additionally, meeting sustainability goals, such as reducing CO2 emissions and managing tailings, demands ongoing tracking and adjustment.
Equipment Reliability and Maintenance: Ensuring the reliability of equipment across multiple sites is challenging, as unplanned downtime and maintenance can severely impact production schedules and increase costs. Predictive maintenance and timely interventions are essential to prevent equipment failures and maintain operational efficiency.
Strategic Decision-Making: Executives require a comprehensive, real-time view of operations across all sites to make informed strategic decisions. Lack of a unified overview hampers proactive management and long-term planning, making it difficult to align operations with corporate objectives and market demands.
Addressing these challenges requires a robust solution that provides real-time event intelligence, integrates diverse data sources, and delivers actionable insights for optimizing operations and ensuring compliance across multiple mining sites.

XMPro’s Intelligent Business Operations Suite (iBOS) provides a comprehensive solution to address the strategic challenges of managing multiple iron ore mining sites. By leveraging advanced analytics, real-time monitoring, and seamless data integration, XMPro iBOS empowers mining companies to achieve operational excellence and sustainability goals.
Data Integration and Real-Time Monitoring: Using the Data Stream Designer and Agent Library, XMPro iBOS integrates data from various mining stages and locations into a unified, real-time view. This ensures continuous oversight, enabling operators to promptly identify and resolve bottlenecks across all sites.
Performance Optimization: XMPro iBOS monitors key metrics like production throughput, fuel consumption, CO2 emissions, and tailings management in real-time. This enables operators to optimize processes, ensure consistent production rates, improve energy efficiency, maintain product quality, and comply with environmental regulations.
Actionable Recommendations and Alerts: The Recommendation Manager in XMPro iBOS provides real-time, data-driven insights and alerts. These actionable recommendations help address potential issues before they escalate, ensuring continuous improvement and operational efficiency.
Strategic Decision-Making: XMPro iBOS offers comprehensive drill-down capabilities, allowing executives to explore detailed views of process efficiency, product quality, and asset reliability. Real-time event intelligence enables informed strategic decisions based on the most current data, ensuring proactive management and alignment with corporate goals.
XMPro AI: XMPro iBOS integrates advanced AI capabilities to enhance decision-making and operational efficiency. XMPro AI analyzes vast amounts of data, identifies patterns, and predicts potential issues before they arise. This AI-driven approach enables more accurate forecasting, proactive maintenance, and smarter resource allocation, further optimizing mining operations.
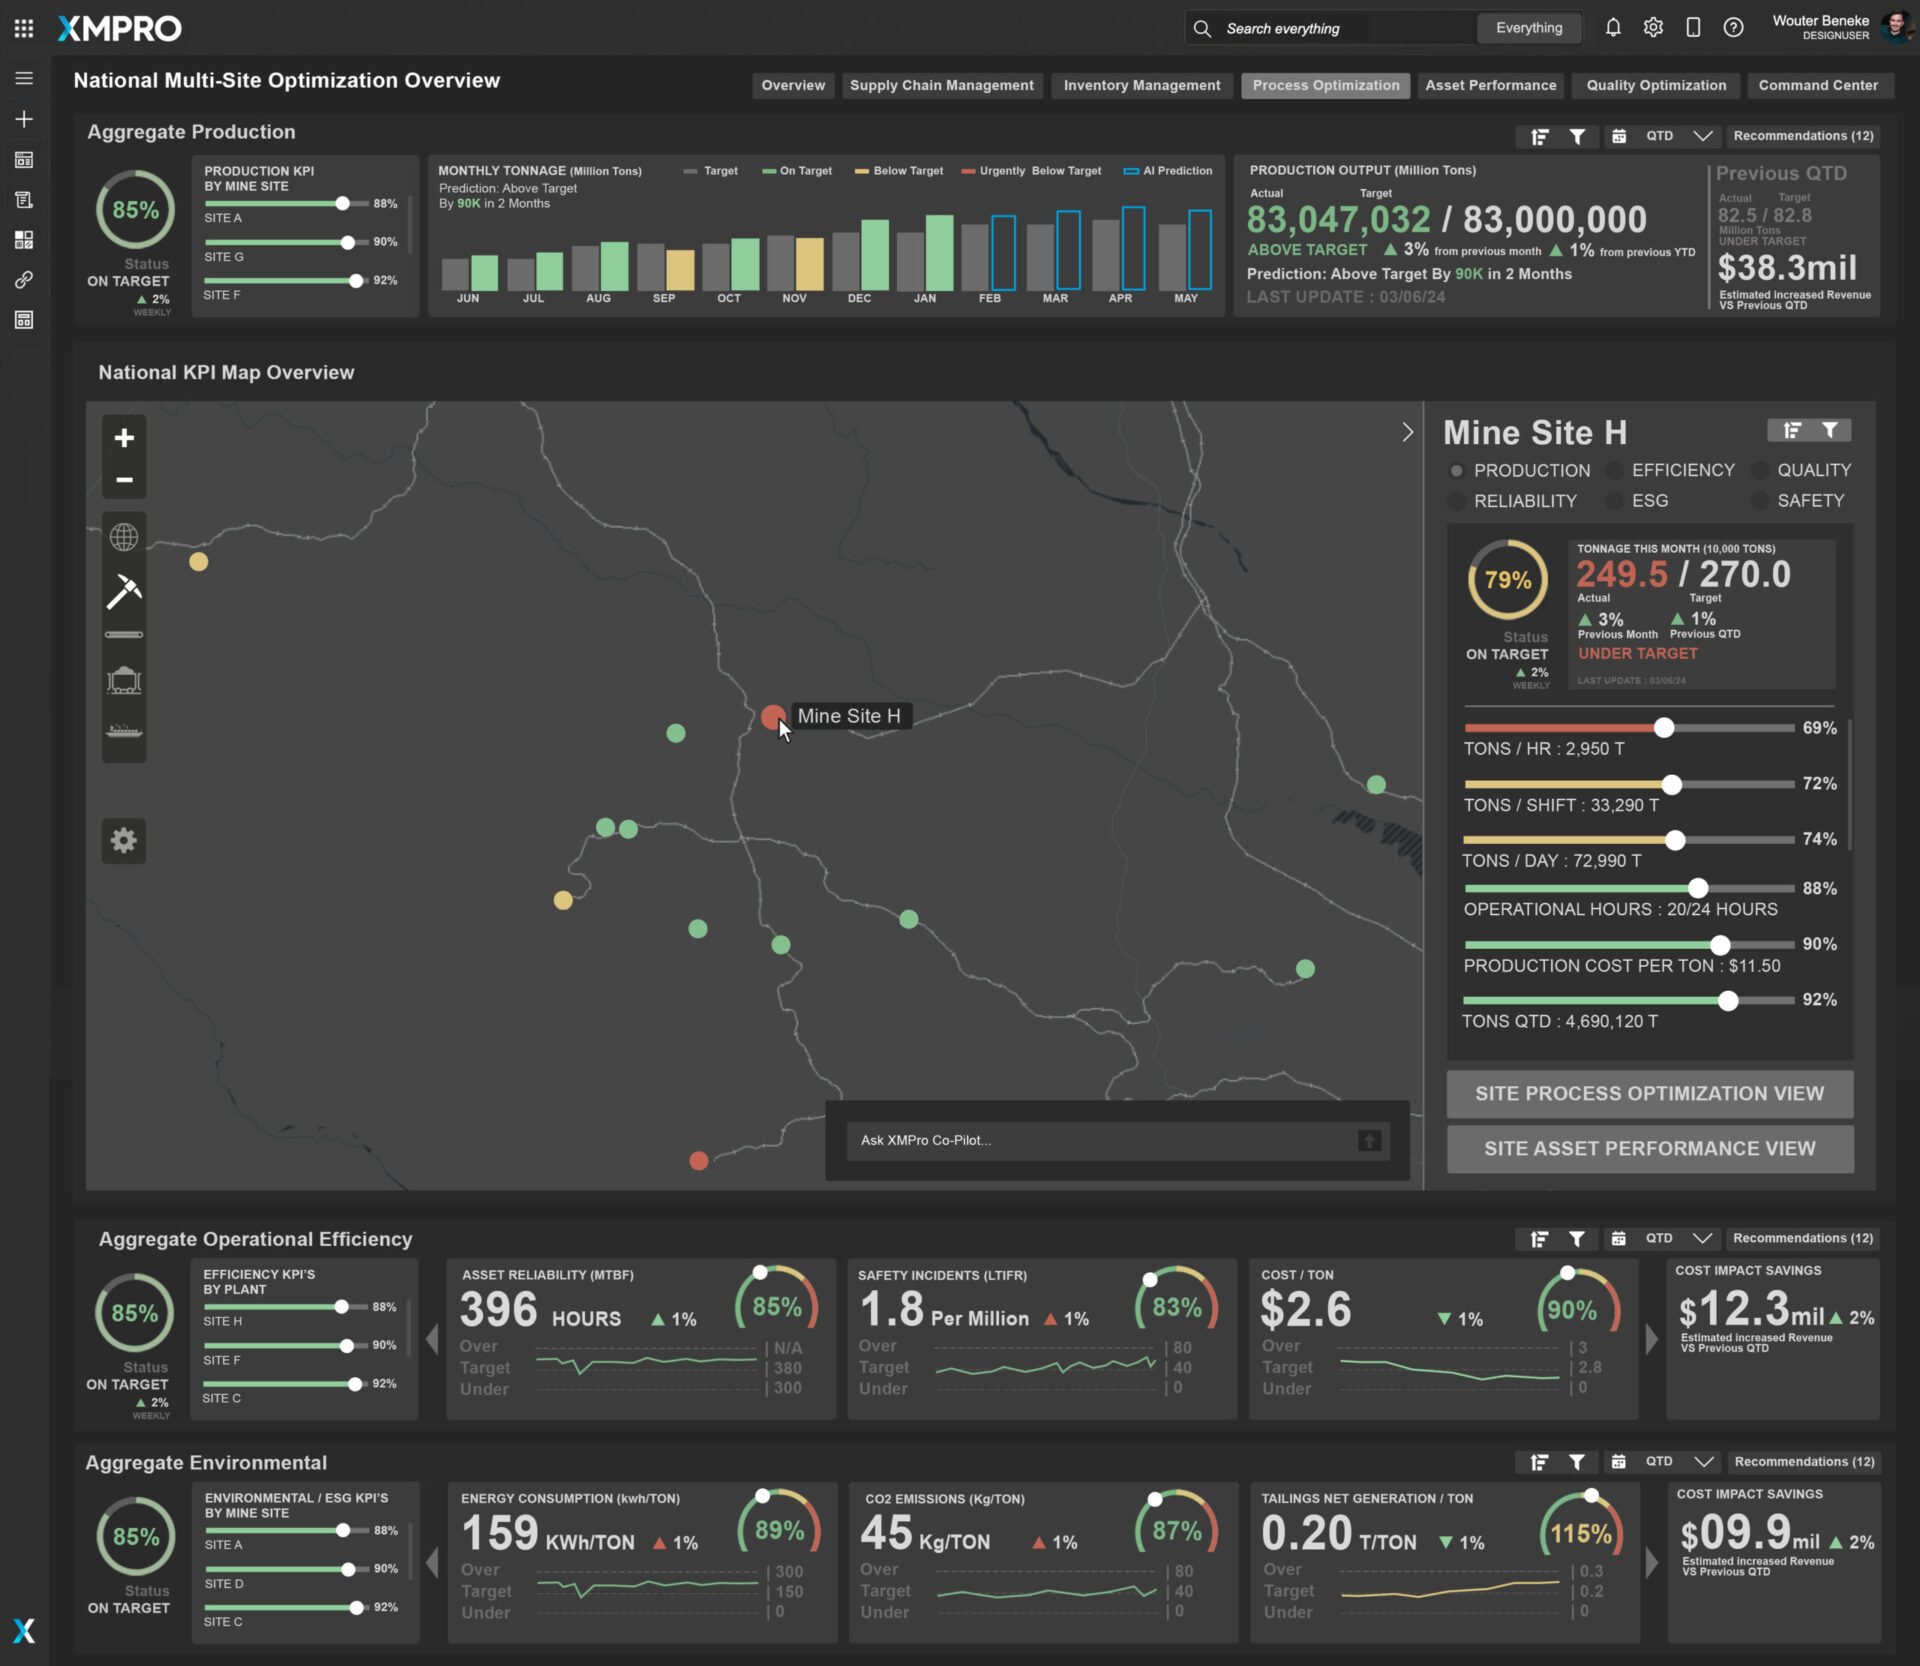
Figure 1: National Multi-Site Optimization Overview For Iron Ore Mines
The National Multi-Site Optimization Overview is pivotal for monitoring and optimizing the operational efficiency of multiple iron ore mining sites in real time. This dashboard offers a comprehensive view of aggregate production, operational efficiency, and environmental impact across all locations, enabling strategic decision-making and proactive management.
Aggregate Production The top section of the dashboard provides a high-level view of aggregate production metrics, including production KPIs by mine site and monthly tonnage breakdowns. This allows executives to monitor overall production performance and identify trends or deviations from targets. For example, real-time data on production levels helps in making informed decisions on resource allocation and addressing production bottlenecks.
Real-Time National KPI Map Overview The interactive map displays the status of each mine site, highlighting production efficiency, reliability, and quality metrics. This visual tool is crucial for identifying underperforming sites and understanding the geographic distribution of operational challenges. Insights gained from the map can include identifying regions with higher operational risks or areas where immediate intervention is needed to optimize performance.
Aggregate Operational Efficiency Key performance indicators (KPIs) for operational efficiency, such as asset reliability (MTBF), safety incidents (LTIFR), and cost per ton, are tracked and displayed. This section helps in monitoring the health and performance of mining assets, ensuring they are utilized efficiently and maintained proactively. For instance, tracking MTBF provides insights into the reliability of equipment, allowing for timely maintenance and reducing unexpected downtimes.
Aggregate Environmental Environmental KPIs, including energy consumption, CO2 emissions, and tailings net generation, are monitored to ensure compliance with sustainability goals and environmental regulations. Real-time tracking of these metrics helps in identifying opportunities for reducing environmental impact and optimizing resource usage. For example, monitoring CO2 emissions enables the implementation of strategies to minimize carbon footprint and improve energy efficiency.
Detailed Site Analysis The right side of the dashboard offers a drill-down view into specific mine sites, providing detailed metrics such as tons per hour, tons per shift, operational hours, production cost per ton, and total QTD production output. This granular level of detail helps in pinpointing specific issues at individual sites and taking targeted actions to improve performance. Insights might include identifying sites with higher production costs and implementing cost-saving measures.
Recommendations and Alerts The Recommendation Manager generates actionable insights and real-time alerts based on predictive analytics and data analysis. These recommendations help in addressing potential issues before they escalate, ensuring continuous improvement and operational efficiency. For example, alerts on excessive energy consumption or deviations in production quality prompt immediate corrective actions, maintaining optimal performance.
XMPro AI Assistant The XMPro AI Assistant leverages advanced AI capabilities to enhance decision-making and operational efficiency. It analyzes vast amounts of data, identifies patterns, and predicts potential issues before they arise. This AI-driven approach enables more accurate forecasting, proactive maintenance, and smarter resource allocation, further optimizing mining operations.
By leveraging the National Multi-Site Optimization Overview, mining companies can achieve enhanced visibility into their operations, driving efficiency, reducing costs, and ensuring sustainable practices across all sites. This comprehensive dashboard empowers executives to make strategic decisions that align with corporate goals and market demands.
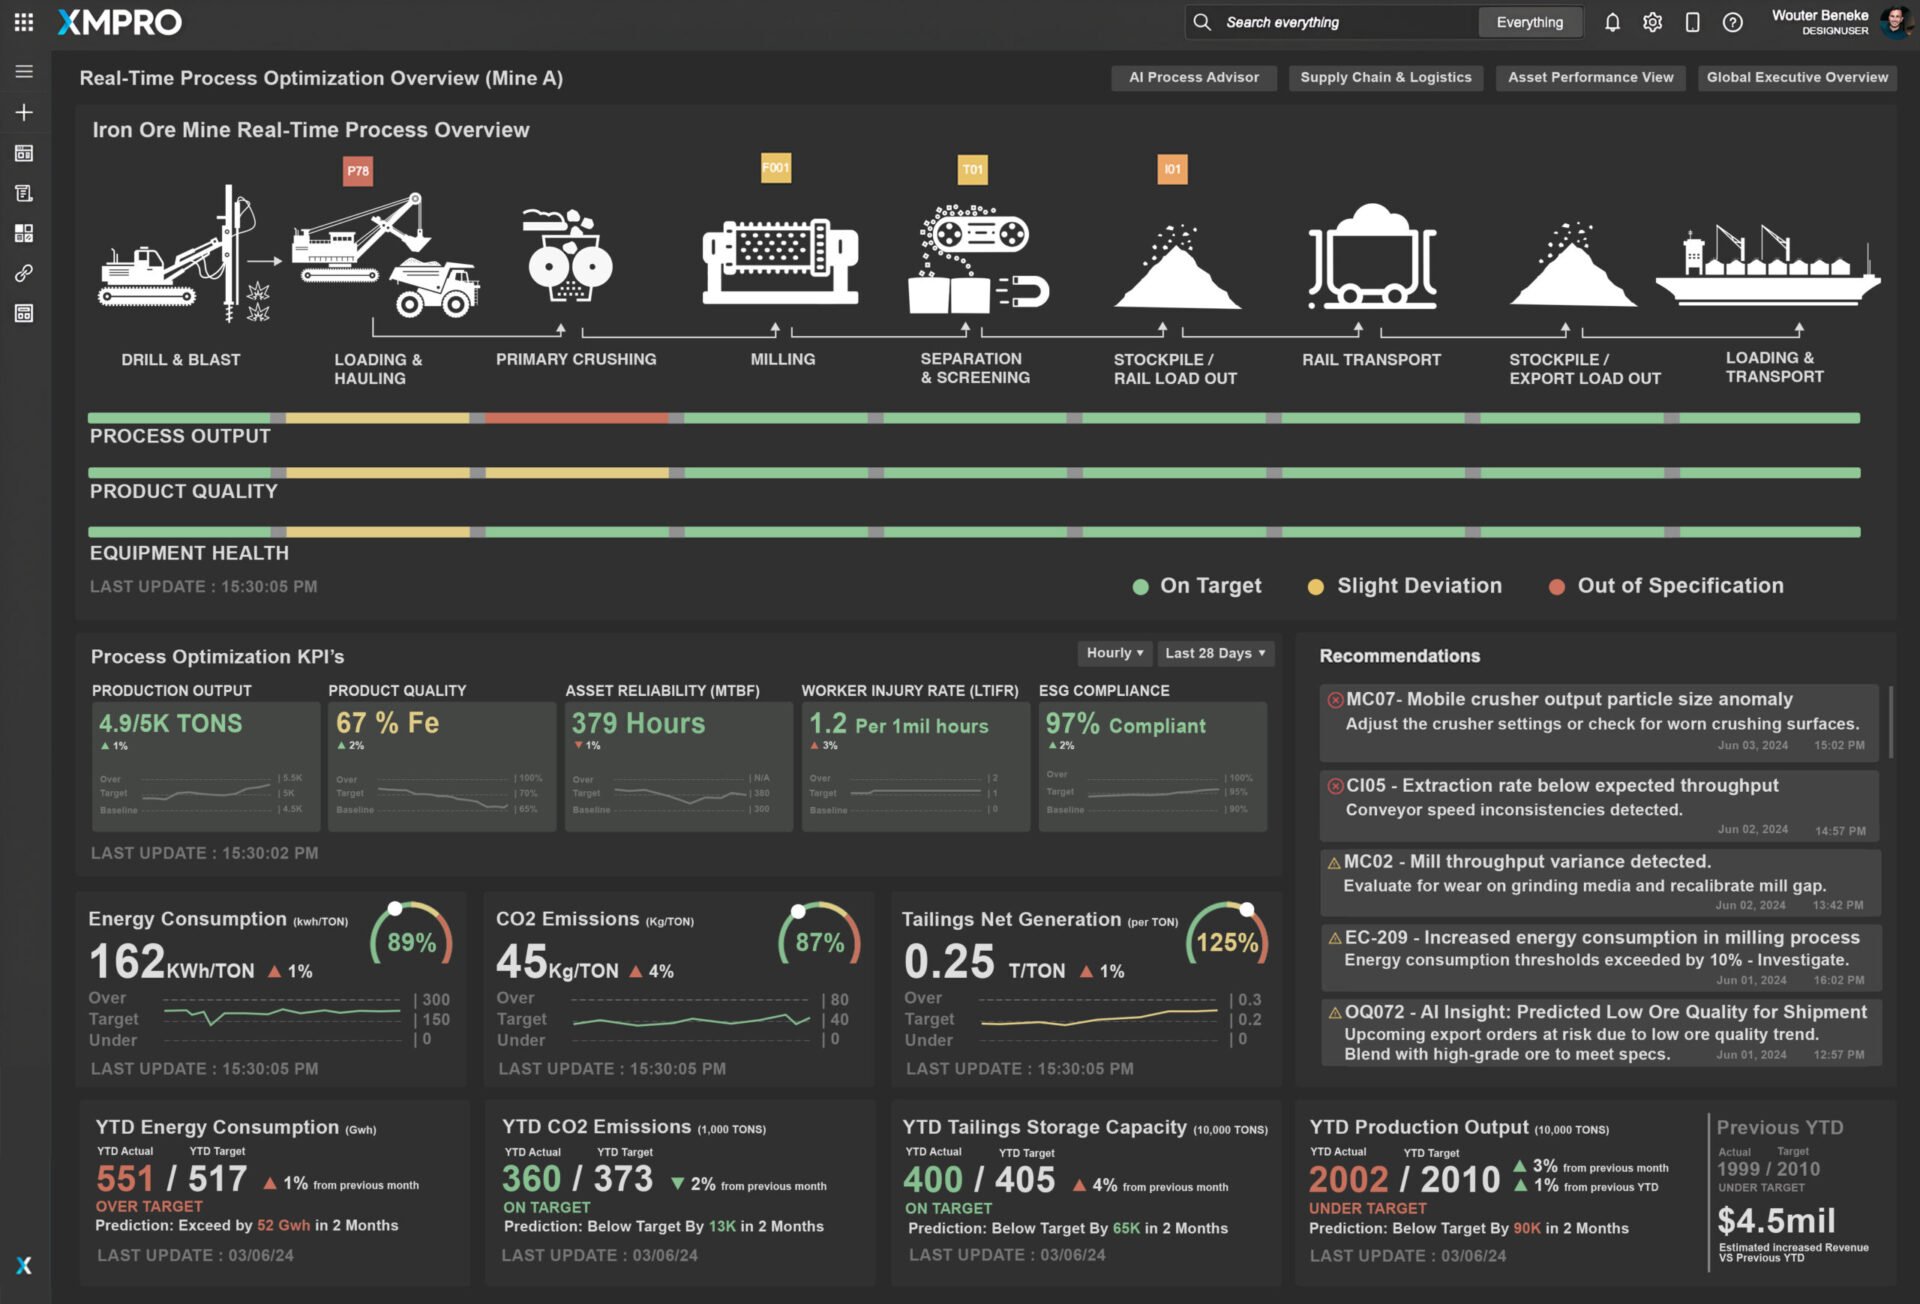
Figure 2: Real-Time Process Optimization Overview – Mine A
The Real-Time Process Optimization Overview provides a comprehensive view of the entire iron ore mining process at Mine A, from drilling and blasting to final loading and transport. This dashboard integrates data across various stages, offering operators critical insights into performance metrics, enabling effective management and optimization of mining activities.
Process Overview The dashboard displays a visual representation of the different stages in the mining process:
Status Indicators Color-coded status indicators show the performance of each process stage in terms of process output, product quality, and equipment health:
Key Performance Indicators (KPIs) The dashboard highlights critical KPIs for process optimization:
Energy and Environmental Metrics
Drill-Down Capabilities XMPro iBOS allows operators to drill down into each step of the process, providing detailed views oriented towards process efficiency, product quality, and asset reliability/equipment health:
Actionable Recommendations and Alerts The dashboard provides real-time recommendations and alerts based on data analysis and predictive analytics:
Operational Insights and Key Benefits
By leveraging the Real-Time Process Optimization Overview, mining operations can achieve enhanced visibility, improve productivity, and drive sustainable operational improvements, maintaining a competitive edge in the industry.
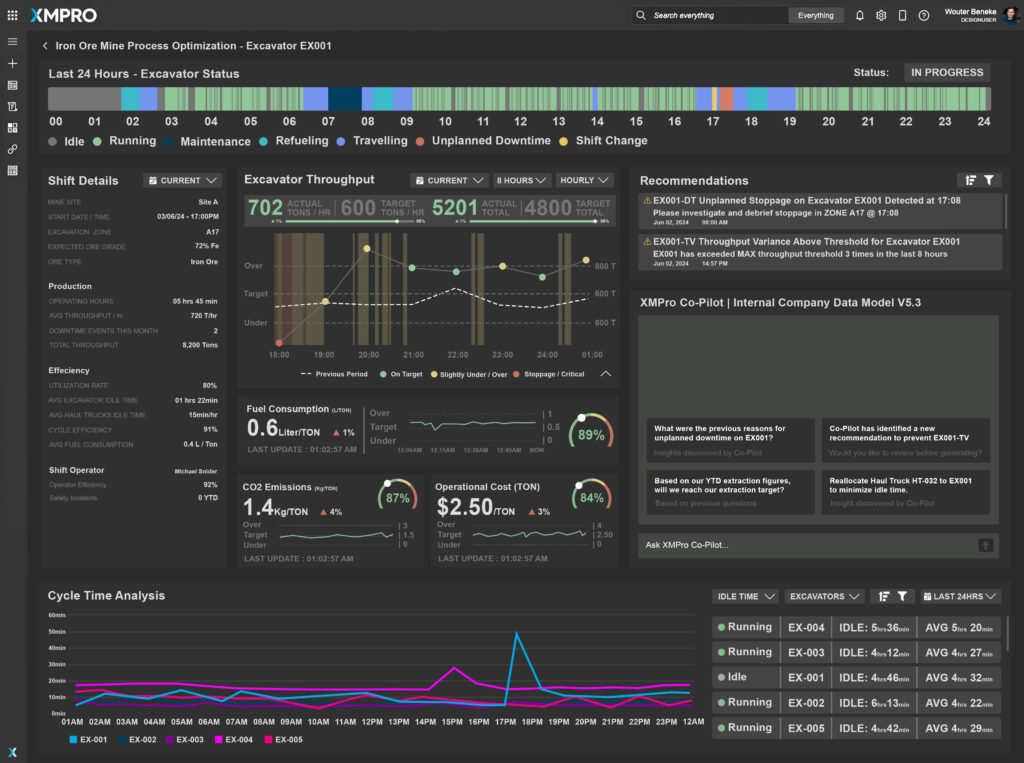
Figure 3: Loading & Hauling Process Optimization View – Mine A
The Loading & Hauling Process Optimization View is instrumental for monitoring and optimizing the operational efficiency of loading and hauling activities in iron ore mining operations. This dashboard provides critical insights into various performance metrics, enabling effective management and optimization of these activities to enhance productivity and reduce operational costs.
Production Throughput by Excavator The dashboard displays throughput metrics for each excavator, including actual versus target throughput in tons per hour. This helps manage productivity by identifying deviations from targets and ensuring optimal asset utilization. For example, consistently falling short of targets may indicate the need for maintenance or operational adjustments.
Production Throughput by Haul Truck Throughput metrics for haul trucks are also shown, detailing actual tons per load compared to target values. This data assists in managing load efficiency and identifying discrepancies. High variance in load weights might suggest issues with loading accuracy or truck capacity utilization.
Real-Time Site Overview The real-time site overview provides a visual representation of the mining site, including the locations of all assets and their current status. This helps in monitoring the overall operation and improving coordination. Identifying areas with high idle times can lead to better planning and resource allocation.
Cycle Time Analysis Analyzes the cycle times for both excavators and haul trucks, presenting data on how long each phase of the cycle takes. This analysis helps pinpoint inefficiencies and bottlenecks in the loading and hauling process. Longer-than-average cycle times may indicate delays in loading or unloading, poor route planning, or equipment issues.
Idle Time Analysis Idle time analysis provides a breakdown of idle times for different assets, highlighting the average idle time over the last 24 hours. This helps identify causes of idle times and enables actions to reduce these periods, improving overall asset utilization. High idle times could be due to poor scheduling, coordination issues between loading and hauling, or equipment downtime.
Recommendations and Alerts The dashboard includes actionable recommendations and real-time alerts based on data analysis. These provide insights into potential issues and suggest corrective actions. For example, alerts for high idle times or excessive load weights prompt immediate operational adjustments to mitigate these issues.
XMPro AI Assistant Queries XMPro AI Assistant generates further insights by querying real-time and historical data. These queries can address questions such as which shifts are responsible for the highest throughput variance or which excavators have the highest idle times between load cycles. This aids in proactive decision-making and continuous improvement.
Increased Productivity By identifying and reducing idle times, optimizing cycle times, and ensuring efficient load distribution, overall productivity is significantly enhanced.
Cost Savings Lower operational costs are achieved through reduced idle times, optimized fuel consumption, and improved cycle efficiency. This leads to significant cost savings.
Enhanced Equipment Longevity Proactive maintenance and operational insights extend the lifespan of both excavators and haul trucks, reducing the need for frequent replacements.
Environmental Compliance Improved fuel efficiency and reduced emissions contribute to better compliance with environmental regulations and sustainability goals.
Safety and Compliance Enhanced visibility into operations and proactive maintenance help maintain safety standards and regulatory compliance.
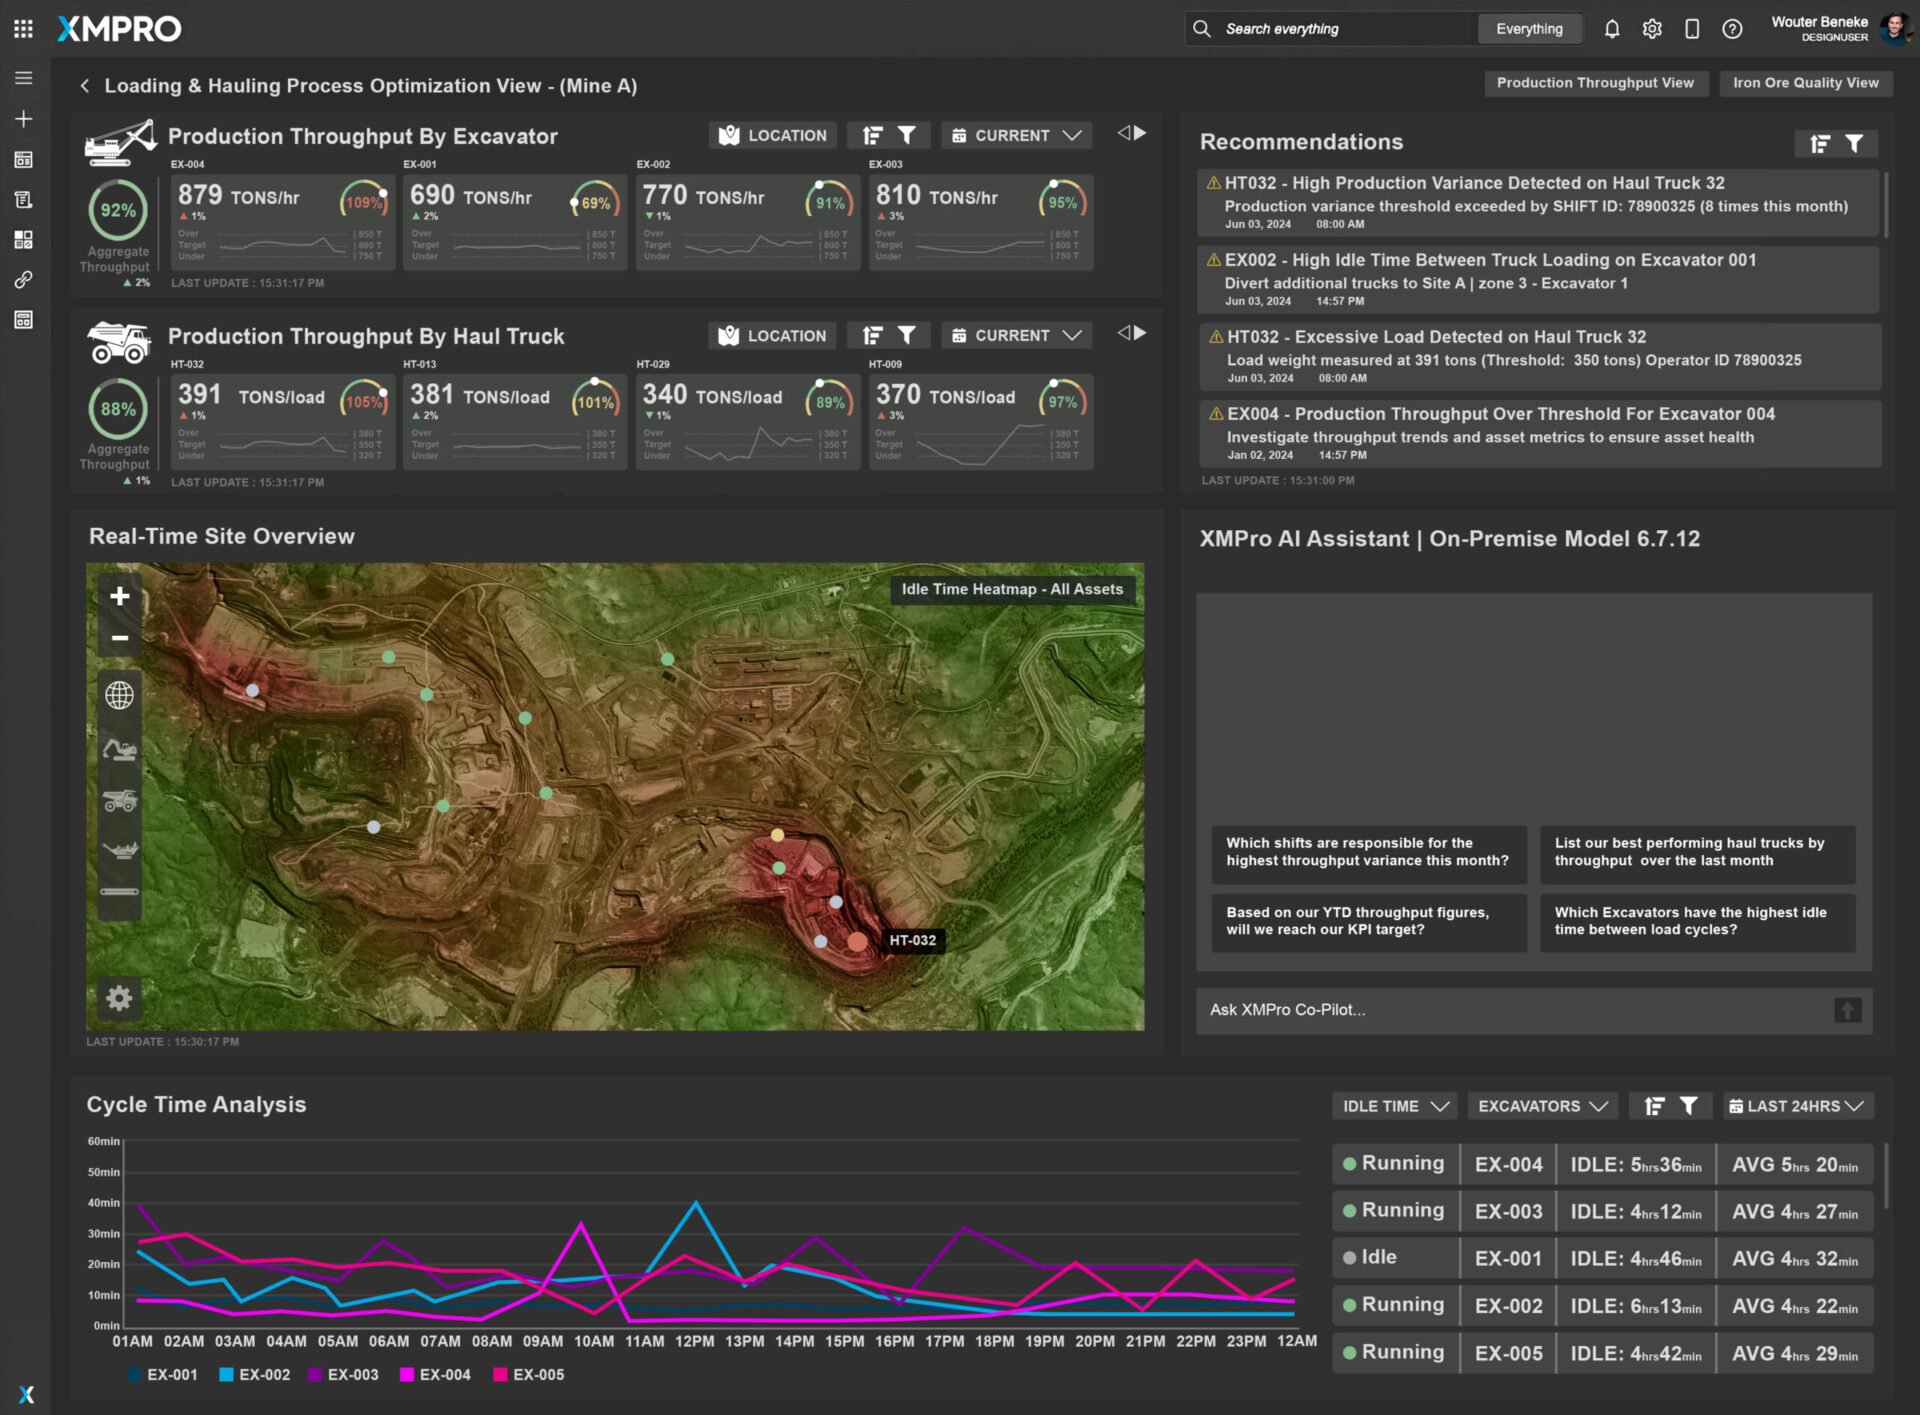
Figure 4: Loading & Hauling Process Optimization View – Mine A ( idle time heatmap)
Real-Time Site Overview with Idle Time Heatmap The real-time site overview with the idle time heatmap provides a visual representation of the mining site, including the locations of all assets and their current status, with a specific focus on idle times. The heatmap highlights areas with high idle times, allowing for easy identification of inefficiencies. This visualization helps in monitoring overall operations and improving coordination. For instance, areas with concentrated idle times can be targeted for process improvements or resource reallocation.

Figure 5: Drilldown Asset Analysis View – Mobile Asset Process Optimization
The Drilldown Asset Analysis View is crucial for monitoring and optimizing the operational efficiency of mobile assets such as excavators, haul trucks, and mobile crushers in iron ore mining operations. This dashboard provides detailed insights into various performance metrics, enabling effective management and optimization of these assets to enhance productivity and reduce operational costs.
Mobile Asset Status Timeline The visual representation of the status of mobile assets over the last 24 hours, including running, idle, maintenance, refueling, traveling, unplanned downtime, and shift changes, identifies patterns of inefficiency and informs better scheduling and resource allocation. For example, frequent idle periods may highlight issues with coordination or poor shift planning.
Shift Details Detailed shift information, such as mine site, excavation zone, expected ore grade, and production metrics like operating hours and average throughput, offers a snapshot of current operations, aiding in real-time decision-making and performance tracking. Insights can include recognizing shifts with higher productivity or identifying zones with more frequent downtime.
Mobile Asset Throughput Throughput metrics display actual versus target throughput in tons per hour for mobile assets, helping to manage productivity, identify deviations, and ensure optimal asset utilization. This can reveal whether the equipment is consistently underperforming or exceeding targets, prompting adjustments to operational strategies.
Fuel Consumption Monitoring fuel consumption and CO2 emissions for mobile assets provides insights into fuel efficiency and environmental impact, essential for reducing operational costs and achieving sustainability goals. For instance, unexpected increases in fuel consumption might indicate engine inefficiencies or the need for maintenance.
Operational Cost The operational cost per ton metric offers a clear view of financial efficiency, highlighting cost-saving opportunities. Insights might include identifying high-cost periods and correlating them with specific operational activities or maintenance events.
Cycle Time Analysis Cycle time and idle time analyses pinpoint inefficiencies in the excavation, loading, and hauling processes, addressing issues related to planning and improving overall efficiency. For example, longer cycle times may suggest bottlenecks in the process or delays in asset availability.
Idle Time Analysis Idle time analysis highlights the average idle time over the last 24 hours for different mobile assets, identifying causes of idle times and enabling actions to reduce idle periods and improve asset utilization. This can reveal if specific assets are idling more frequently, suggesting targeted improvements.
Recommendations and Alerts The dashboard provides actionable recommendations and real-time alerts based on data analysis, offering insights into potential issues and suggesting corrective actions. For example, an alert for high fuel consumption could lead to immediate checks and preventive measures.
XMPro AI Assistant Queries XMPro AI Assistant queries generate further insights, aiding proactive decision-making and continuous improvement. These queries might include analysis of reasons for unplanned downtime or suggestions for improving operator performance based on historical data.
Increased Productivity By identifying and reducing idle times, optimizing throughput, and addressing inefficiencies, productivity is significantly enhanced. For example, aligning shift changes with optimal operational periods can boost overall productivity.
Cost Savings Lower fuel consumption, reduced maintenance costs, and improved operational efficiency lead to substantial cost savings. Identifying and mitigating periods of high operational cost can significantly reduce expenses.
Enhanced Equipment Longevity Proactive maintenance and operational insights extend the lifespan of mobile assets, reducing the need for frequent replacements. This ensures that equipment is maintained before issues become critical.
Environmental Compliance Improved fuel efficiency and reduced emissions contribute to better compliance with environmental regulations and sustainability goals. Monitoring CO2 emissions helps maintain adherence to regulatory standards.
Safety and Compliance Enhanced visibility into operations and proactive maintenance help maintain safety standards and regulatory compliance. Ensuring that mobile asset operations are within safe parameters reduces the risk of accidents.
By leveraging the Drilldown Asset Analysis View for mobile assets, mining operations can achieve enhanced visibility into their processes, leading to improved productivity, cost savings, and optimized resource utilization.
XMPro’s Intelligent Business Operations Suite (iBOS) is expertly devised for the intricate challenges faced in the process optimization and asset performance management within the iron ore mining industry. Here’s the transformation it brings:

XMPro iBOS constructs sophisticated digital twins, reflecting the detailed operations of mining equipment. It allows comprehensive performance analysis under varied conditions, vital for operational optimization.

Real-time sensor data across mobile assets offer critical insights into performance metrics like vibration, load capacity, and engine status, which are essential for detecting early signs of potential failures and maintenance needs.

Utilizing advanced analytics, XMPro iBOS predicts potential asset failures, enhancing operational parameters and enabling preventive adjustments, thereby ensuring continuous mining operations with minimized downtimes.

Performance data drives XMPro iBOS’s maintenance scheduling, transforming the approach from reactive to proactive, optimizing the maintenance cycle for various assets, and significantly reducing breakdowns.

Real-time monitoring and predictive alerting are critical components of XMPro’s iBOS for managing mobile assets within the mining industry. This ensures each mobile asset, from haul trucks to dozers, functions within the optimal parameters, thus enhancing efficiency and reducing reliance on manual intervention.

XMPro provides configurable dashboards that offer real-time insights into the health and performance of equipment across all dairy processing plants. These dashboards are designed to be interactive, enabling detailed scrutiny of specific operational aspects and supporting centralized management decisions.

Designed to accommodate dairy operations of any scale, XMPro’s modular architecture allows for seamless integration and adaptability. This scalability ensures that mining plants can efficiently manage operations as they expand or adapt to changing market demands.

XMPro boosts operational safety by identifying potential hazards and inefficiencies in the processing line, ensuring that all equipment operates within safe and optimal parameters. This contributes to a safer working environment and more efficient production processes.

Offering quick time-to-value, XMPro Blueprints facilitate rapid deployment of intelligent operations solutions across mining operations. These templates are built on industry best practices, ensuring that plants can quickly realize the benefits of digital transformation.
XMPro iBOS caters to the predictive maintenance needs of the mining industry’s mobile assets with a suite that promises comprehensive, predictive, and integrated solutions, driving efficiency and safety across operations.

"*" indicates required fields