


Documentation
Get detailed guidance on platform features
As urban populations grow, cities are adopting smarter technology solutions to enhance livability, workability, and sustainability. Smart cities leverage interconnected data and advanced analytics to improve public services, infrastructure, and environmental health. The Smart City Overview Dashboard serves as the central nervous system for these urban centers, providing a consolidated view across various city functions and enabling proactive management of city resources.
Smart cities encounter multifaceted challenges in their pursuit of operational excellence:
.
XMPro iBOS transforms smart city governance by providing an interconnected platform that collates, analyzes, and acts upon data from across urban systems, driving performance management to new heights.
Key Features
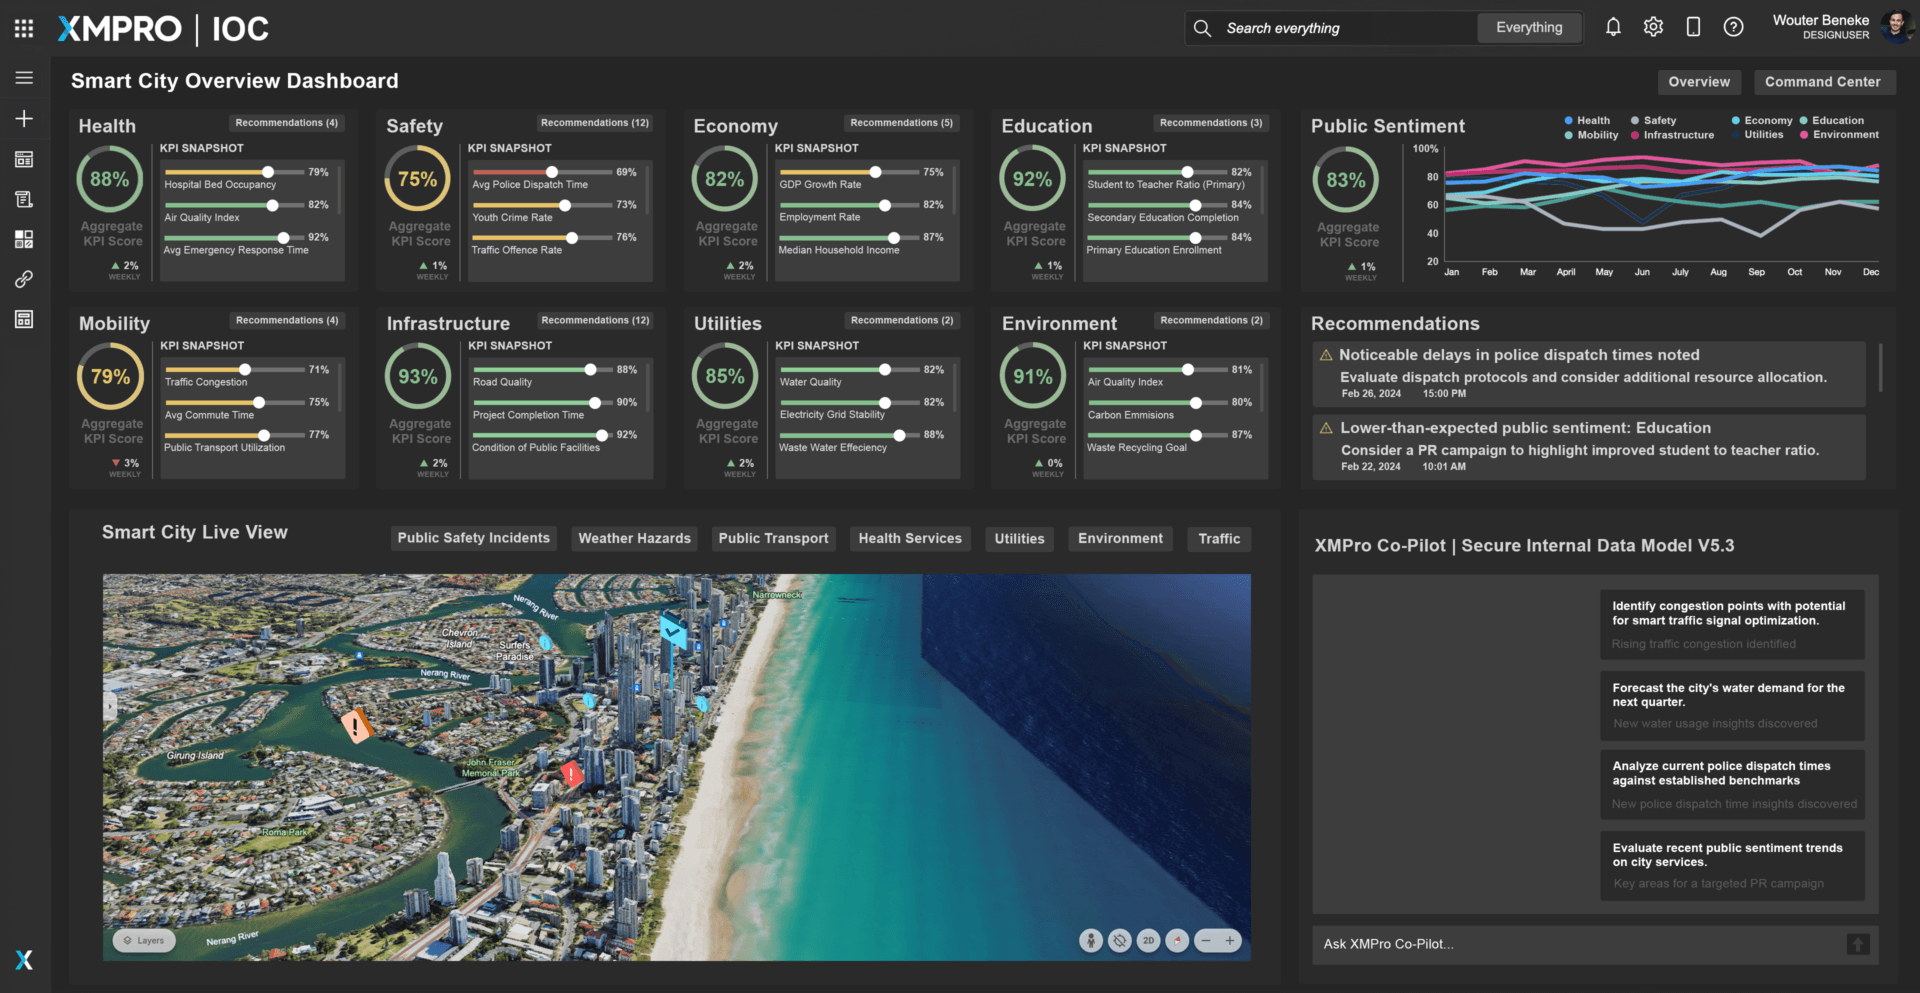
Figure 1. Performance Management Smart City Overview Dashboard
Designed for urban management teams and civic leaders, this comprehensive dashboard centralizes critical metrics from various city departments. It provides an integrated view of city operations, stretching from public health and safety to environmental quality and infrastructure management. This tool is vital for a mayor or city manager who needs to maintain an effective, responsive, and transparent governance system. Interactive elements offer real-time updates, highlighting the status of essential city services and facilities, reflecting the city’s pulse in a dynamic and accessible manner.
Key Features:
Integrated Process Monitoring: Showcases real-time data for key performance indicators across health, safety, mobility, and more. The dashboard offers a color-coded KPI snapshot, presenting a clear view of the city’s operational health and enabling quick identification of areas requiring attention.
Public Sentiment Tracking: Integrates real-time sentiment analysis, juxtaposing public opinion data with operational metrics to identify any disconnects between service delivery and citizen perception, vital for PR and communication strategies.
XMPro Co-Pilot AI Integration: Employs the XMPro Co-Pilot, leveraging Generative AI to interpret both historical and real-time data in order to offer predictive insights, automated processes, and actionable recommendations across city systems. Some of our Co-Pilot features include the following:
Sector-Specific Analysis: Delivers detailed performance data and predictive analytics for individual city sectors such as health services, public safety, and environmental management, enabling targeted strategic initiatives.
Proactive Recommendations and Alerts: Generates data-driven recommendations and alerts for strategic adjustments and operational improvements, aligning with city governance objectives and performance standards.
Comprehensive Operational Health Overview: Aggregates data to provide a holistic health assessment of city operations, empowering leaders with the knowledge to swiftly navigate and manage city-wide strategies effectively.
Enhanced Usability and Accessibility: Offers an intuitive interface with advanced search capabilities, simplifying access to intricate details of city operations, thus bolstering administrative efficiency and responsiveness.
Benefits:
The Smart City Overview Dashboard equips city officials with the insights and tools necessary to manage urban centers proactively. It ensures leadership is informed and equipped to maintain high-quality public services, optimize city operations, and uphold community satisfaction. By merging data and analytics, this dashboard supports strategic decision-making, facilitating preemptive management and sustained operational excellence across all facets of city governance.
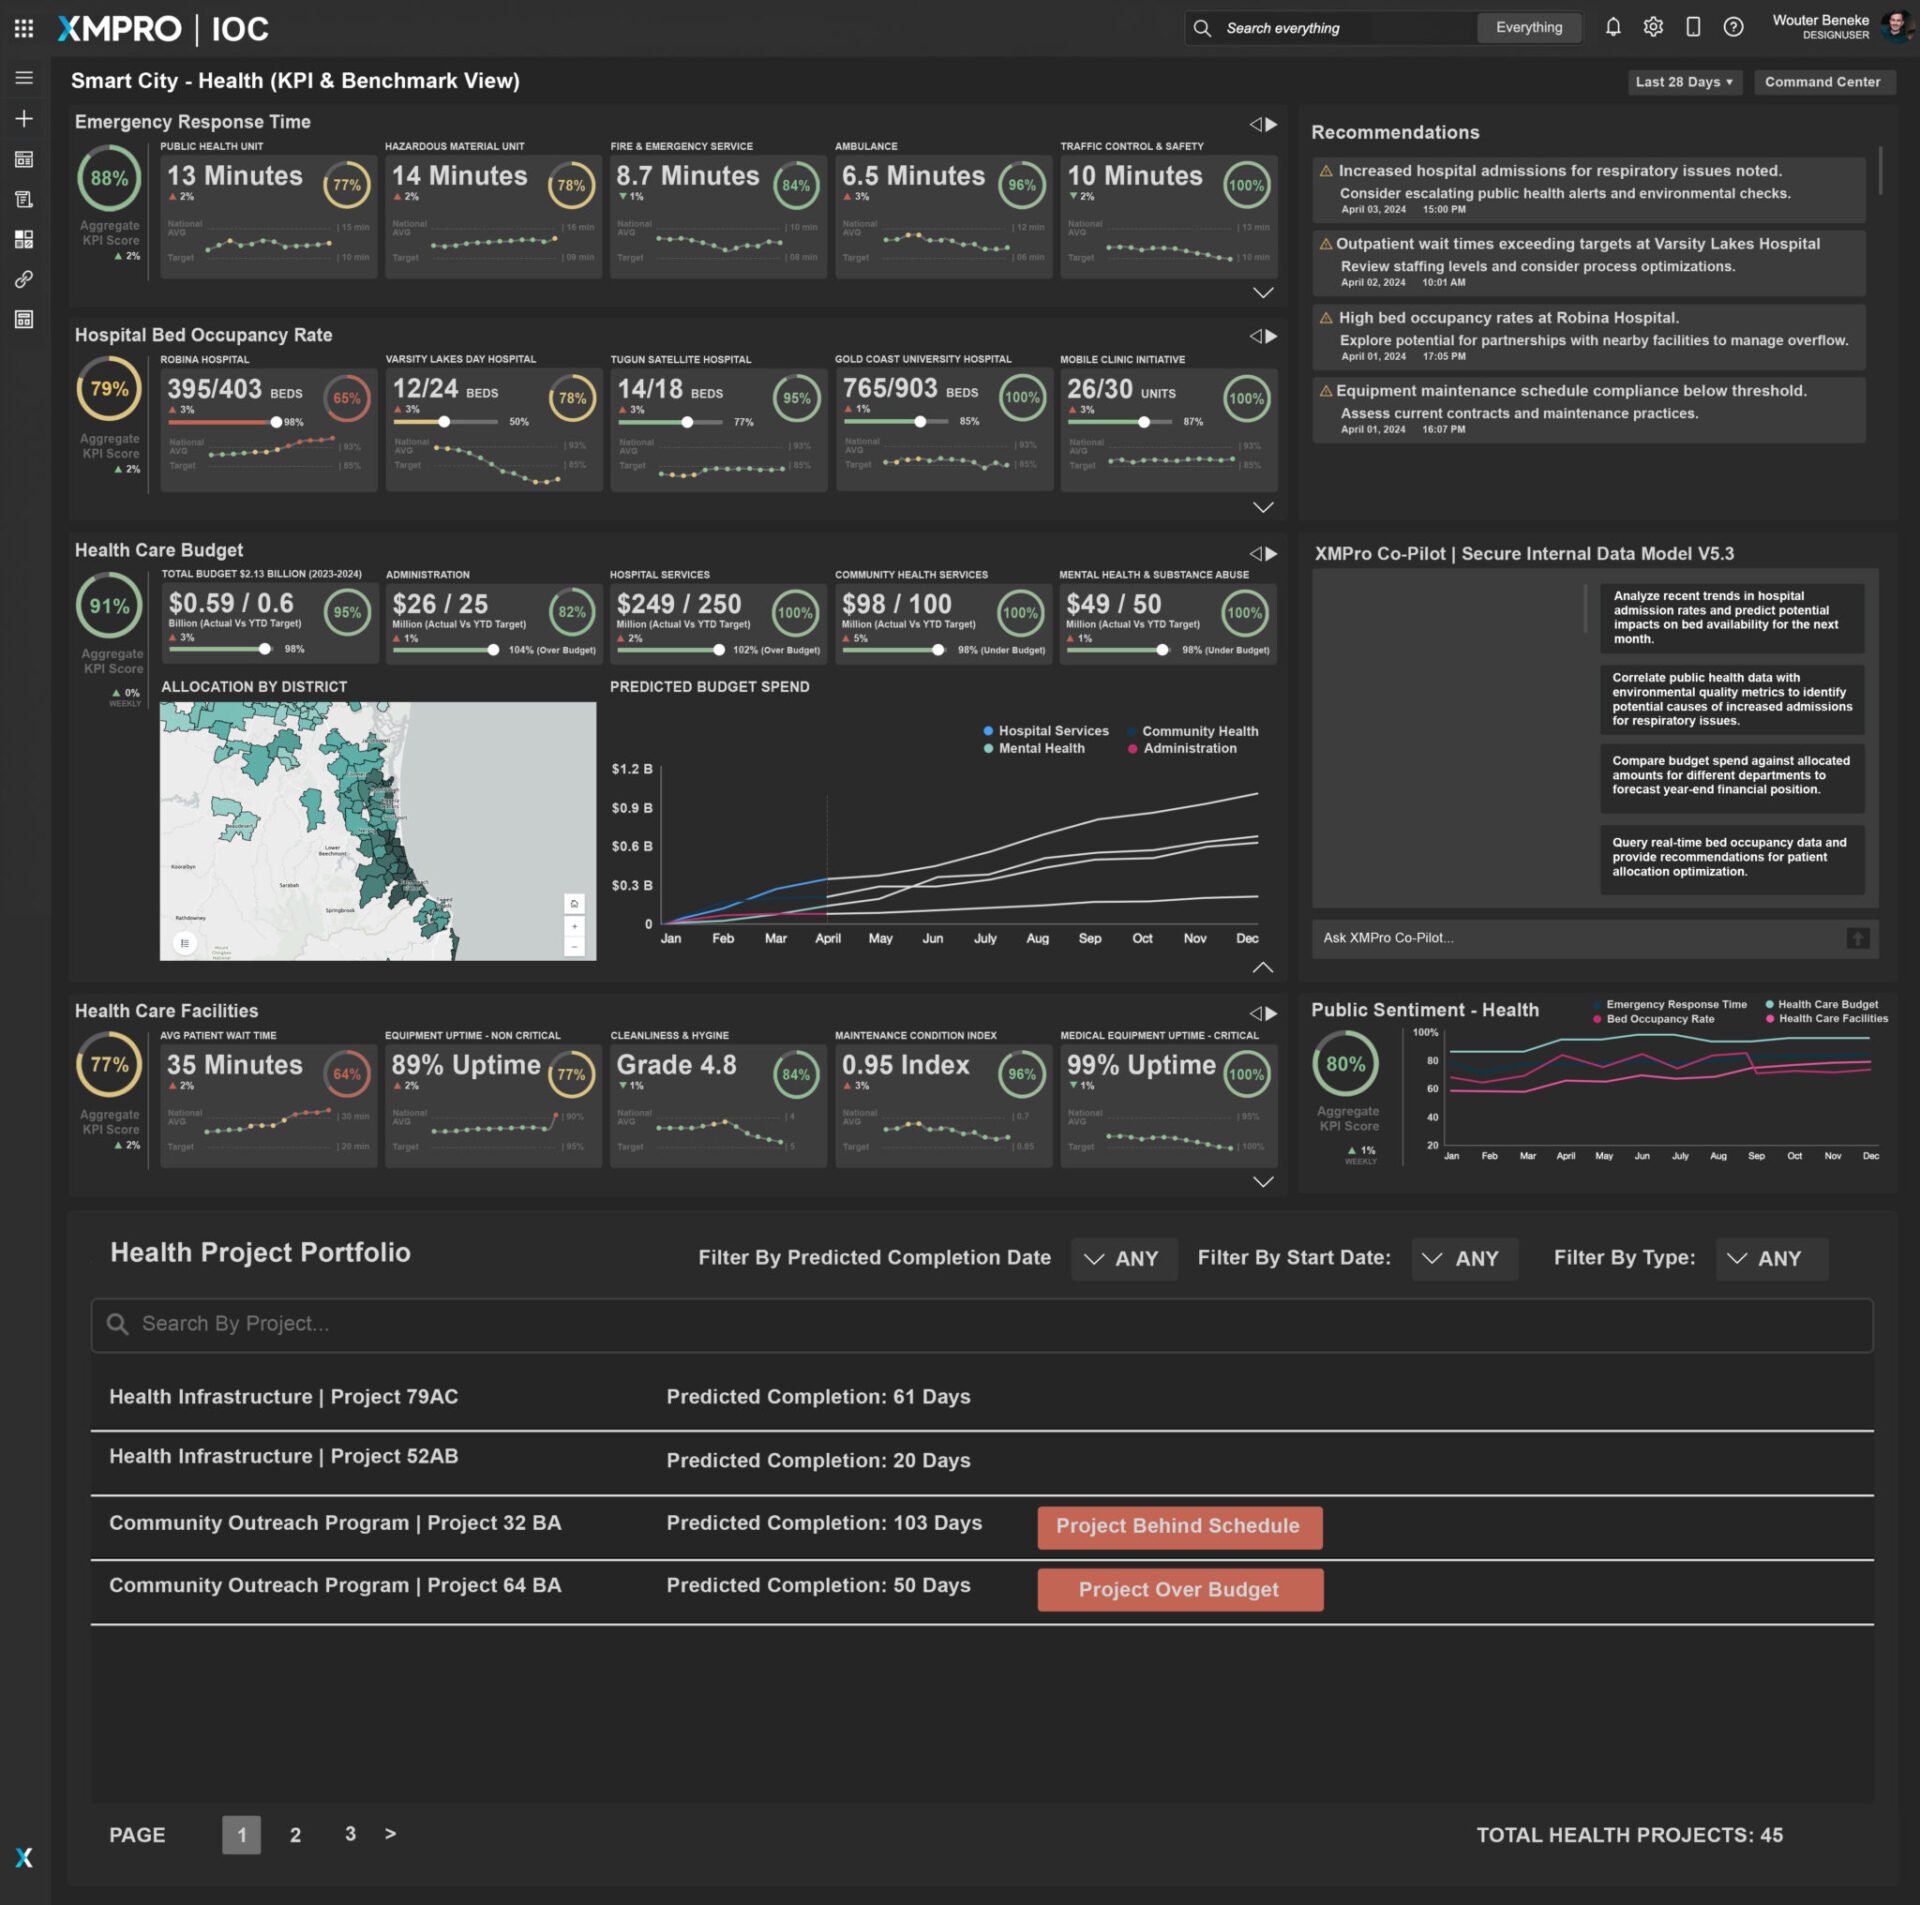
Figure 2: Performance Management View (Health Category) Drilldown Dashboard
This Health Category Drilldown Dashboard is an essential tool for city health administrators and public health officials to monitor and manage the performance of healthcare services within the smart city ecosystem. It presents a focused examination of healthcare delivery, from emergency response times to hospital bed occupancy, and is integral to maintaining public health and safety.
Comprehensive Healthcare Monitoring:
The XMPro Dashboard is meticulously tailored to provide a granular view of the city’s healthcare landscape. It offers a comprehensive overview of key health metrics, such as hospital bed occupancy rates, emergency response times, and the allocation of healthcare budgets across districts. This level of detail is crucial for understanding the capacity and readiness of healthcare services to meet citizen needs.
Healthcare Service Optimization:
The dashboard showcases a live timeline of healthcare services, offering real-time visibility into the operational status of different health facilities. Color-coded indicators reflect the performance of hospitals, allowing for a quick assessment of areas needing immediate action to enhance patient care and service delivery.
Real-time Data Analysis and AI-Enhanced Predictions:
Healthcare officials can assess current operational metrics against established benchmarks through interactive charts, facilitating immediate analysis and decision-making. The XMPro AI Co-Pilot feature extends the capability of the dashboard by providing predictive insights on healthcare demands and resource requirements.
Trend Monitoring and Forecasting:
By integrating historical data, the dashboard allows for tracking the consistency and effectiveness of healthcare service provision over time. Predictive analytics offer foresight into health trends and potential challenges, supported by confidence levels that aid in preemptive planning and resource allocation.
Actionable Intelligence for Healthcare Management:
The XMPro platform delivers actionable recommendations, empowering health officials to refine patient care strategies, allocate resources more efficiently, and address potential shortfalls in service provision, such as adjusting staff allocations or managing patient flow during peak times.
Accountability and Performance Tracking:
Accountability is enhanced by the display of health project portfolios, which include project completion forecasts, alerting managers to projects that are behind schedule or over budget. This visibility ensures that health initiatives progress as planned and within allocated resources.
Health Project Progress Indicators:
A clear indicator of each health project’s status, including real-time progress, enriches the dashboard’s utility, providing officials with an instant snapshot of ongoing healthcare initiatives and their adherence to projected timelines and budgets.
The Health Category Drilldown Dashboard is indispensable for ensuring that health-related operations in smart cities are conducted with precision, efficiency, and adaptability, ultimately fostering a healthy urban environment and proactive public health management.
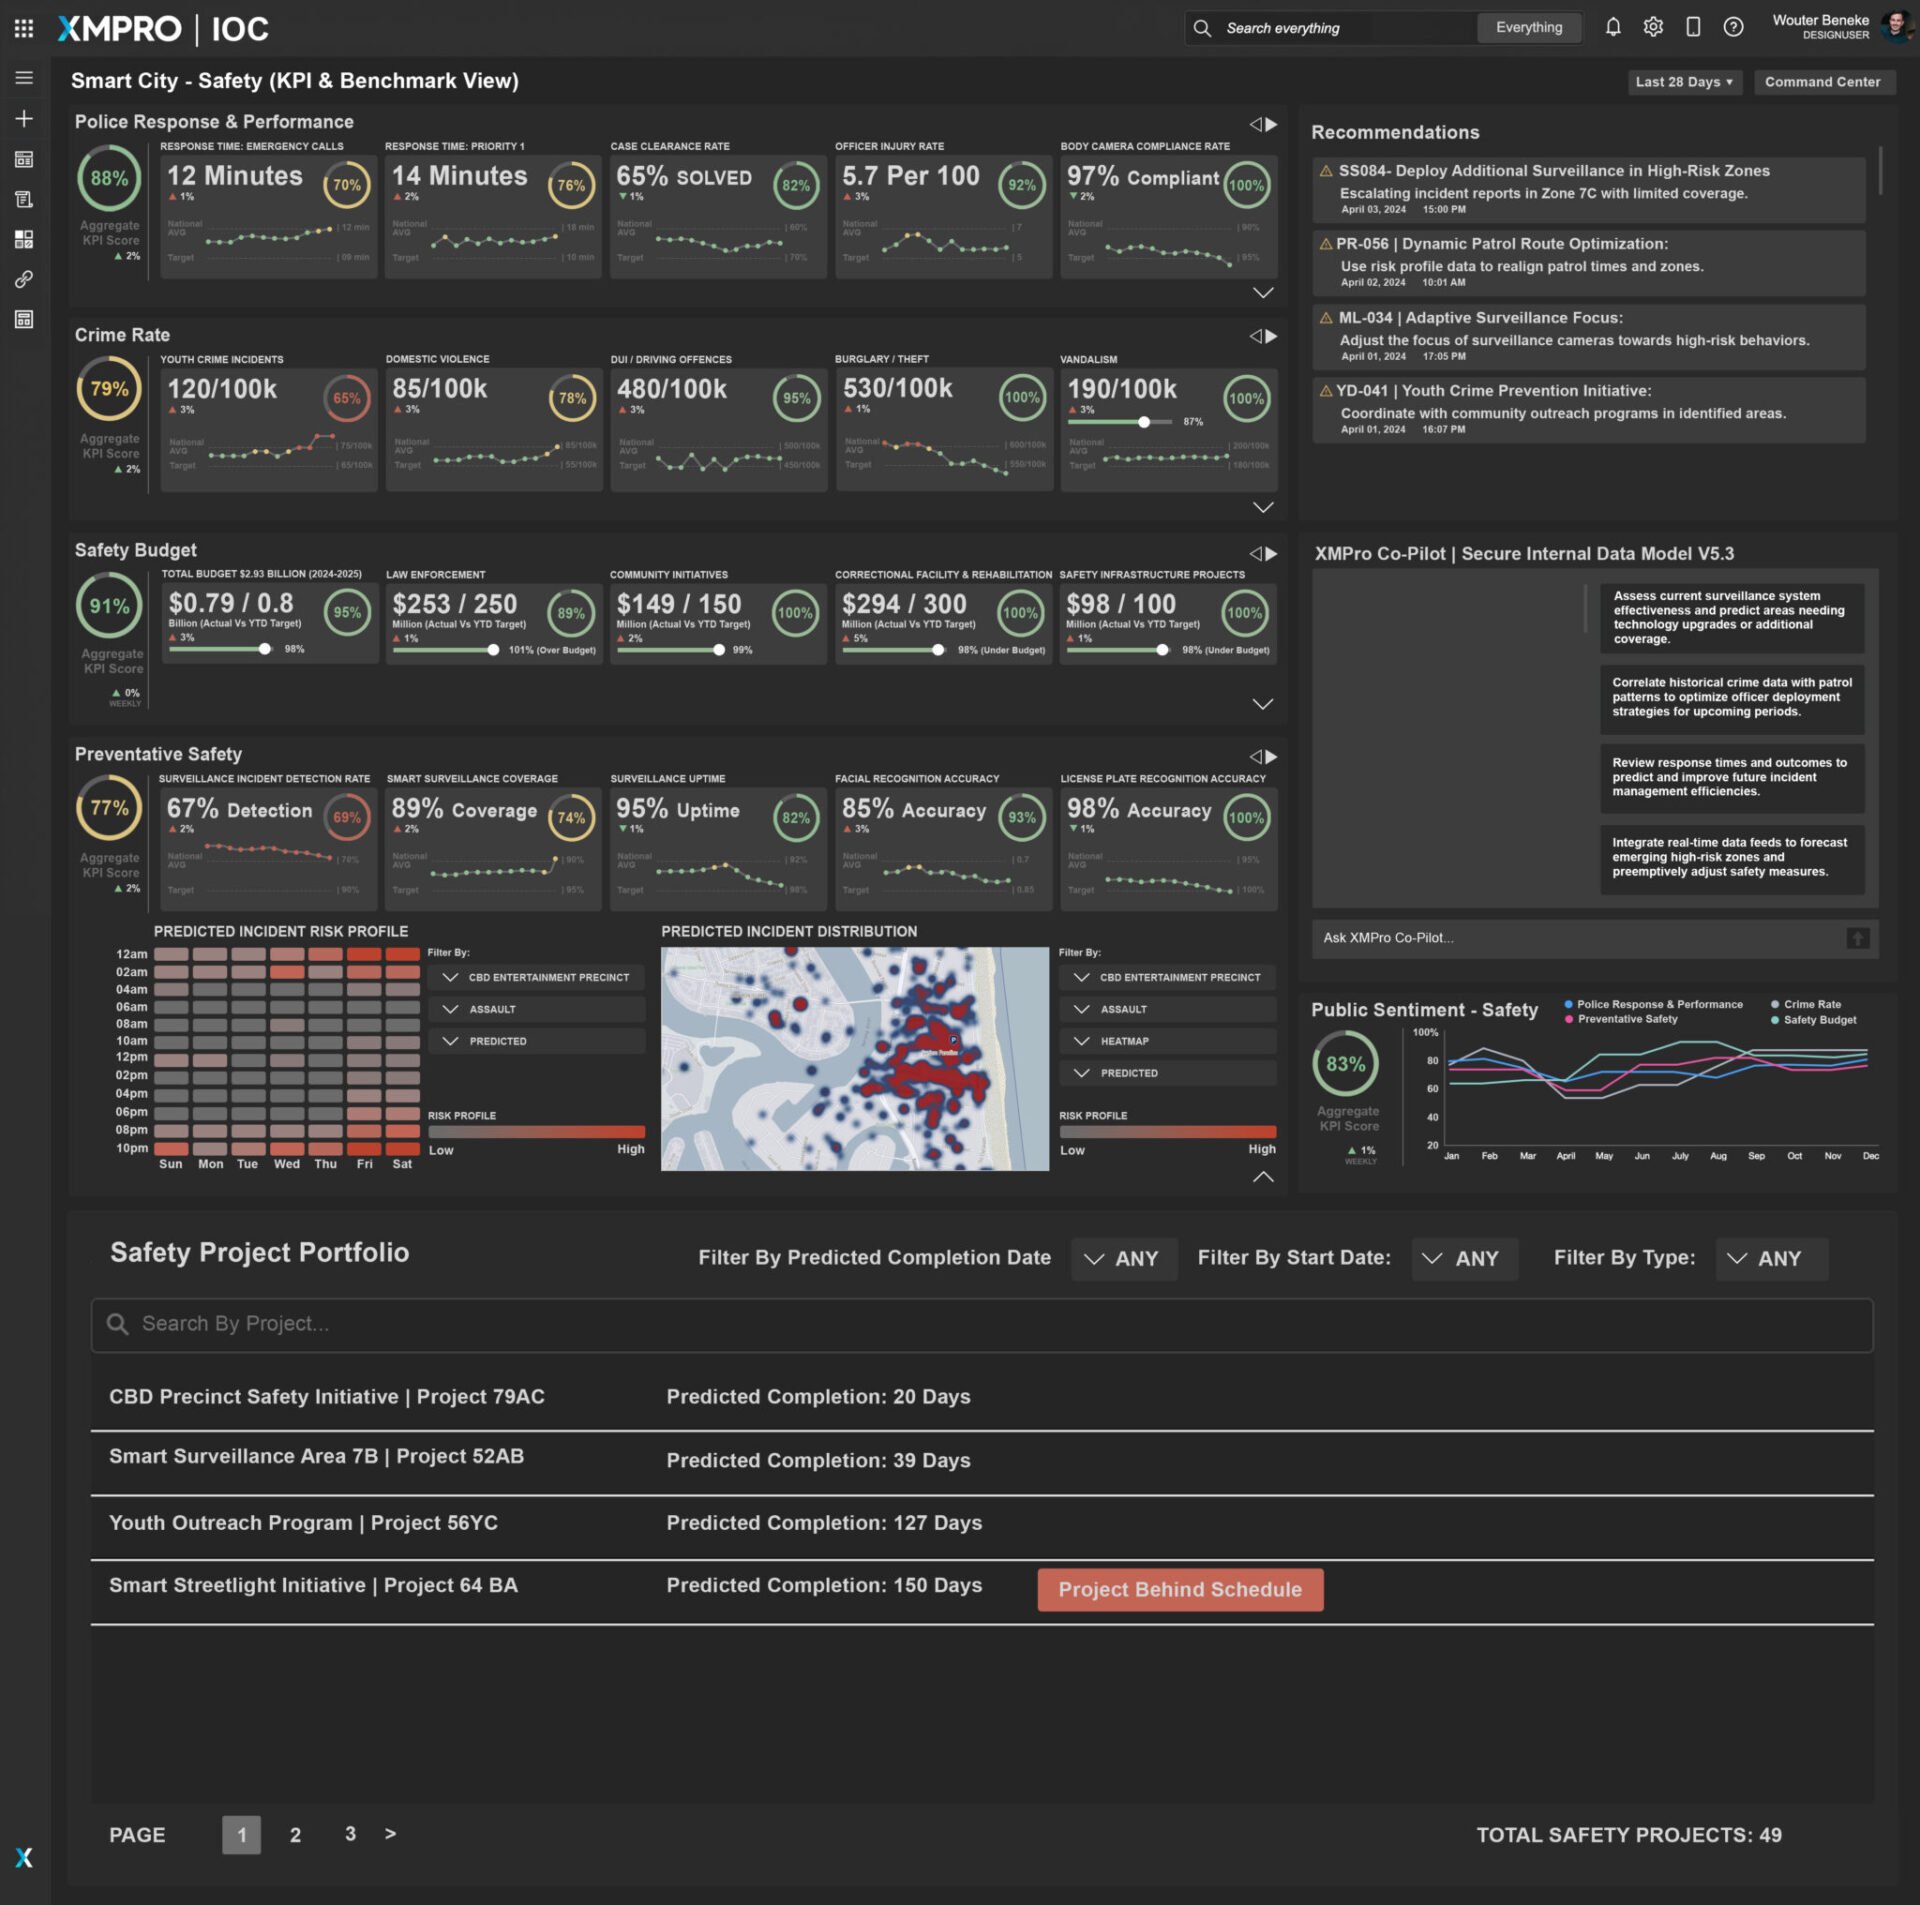
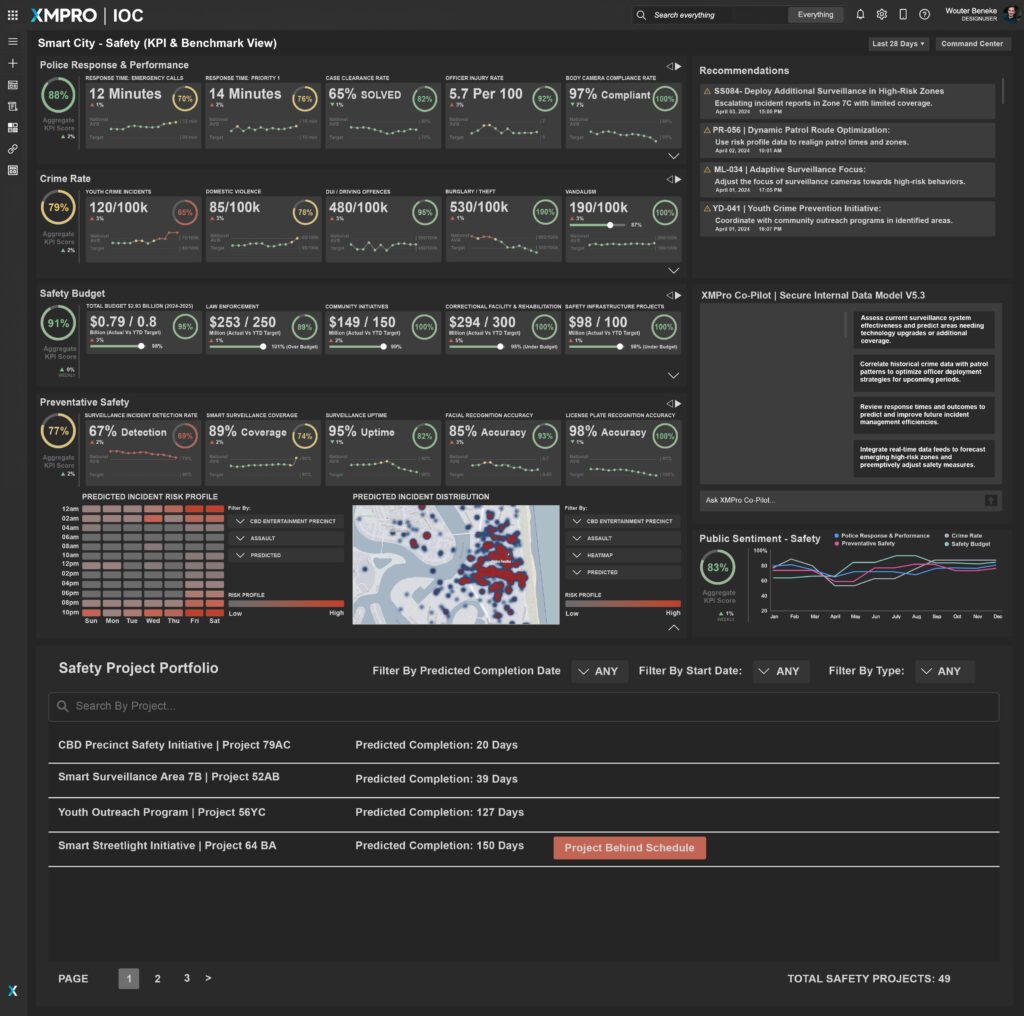
Figure 3: Performance Management View (Safety Category) Drilldown Dashboard
The Safety Category Drilldown Dashboard stands as an indispensable resource for urban safety officials and first responders in smart cities. By encapsulating data points ranging from crime rates to emergency response efficacy, it equips stakeholders with a detailed depiction of the city’s safety landscape, enhancing their capacity for vigilance and responsiveness.
Comprehensive Safety Monitoring: This dashboard rigorously tracks various safety-related metrics, such as crime rates and police response times, facilitating a rapid assessment and response to emerging public safety concerns. The benefit of this comprehensive monitoring is a significant increase in incident preparedness, enabling officials to deploy resources effectively and safeguard the community.
Proactive Safety Measures and Resource Allocation: With real-time updates and trend analysis, the dashboard provides transparency in the city’s safety performance. This capability ensures judicious resource allocation, enhancing preventive measures and optimizing emergency service deployment. The benefit is a tangible improvement in operational efficiency, translating into quicker and more coordinated emergency responses.
Predictive Analytics for Crime Prevention and Response: Integrating the XMPro Co-Pilot, the dashboard employs predictive analytics to report and foresee potential safety incidents. This predictive function allows for preemptive action in public safety and strategic emergency response planning. The benefit here is informed decision-making, empowering officials to devise proactive strategies that preemptively mitigate risks and enhance community well-being.
Safety Project Portfolio Management: The dashboard offers an oversight of ongoing safety projects with predictive completion dates and status updates, crucial for tracking progress and timely execution. The benefit of this feature is enhanced project management, enabling officials to keep safety initiatives on track and within budget, which directly contributes to the city’s overall safety governance.
Each of these features brings a benefit that collectively elevates the city’s safety operations, resulting in a safer, more engaged community. The use of real-time data and AI-driven insights fosters a proactive approach to urban safety challenges, ensuring that smart cities are not only reactive to today’s needs but are also prepared for tomorrow’s demands.
XMPro’s Intelligent Business Operations Suite (iBOS) delivers customized solutions to meet the complex needs of managing a smart city’s multifaceted operations. Here’s how XMPro iBOS is revolutionizing Smart City Performance Management:

XMPro iBOS constructs comprehensive digital twins of city operations, reflecting the intricacies of urban management systems. These digital twins enable simulations and analyses of various scenarios, crucial for optimizing services ranging from traffic flow to emergency responses.

XMPro iBOS harnesses sensor data from across city infrastructure to monitor key metrics like traffic density, energy consumption, and air quality. By offering a unified view of these metrics, it provides a basis for performance improvement across city services, ensuring efficiency and reliability.

Leveraging cutting-edge predictive analytics, XMPro iBOS anticipates potential service disruptions and optimizes operational parameters across city departments. This foresight promotes strategic, data-driven decisions, enhancing city-wide productivity and reducing inefficiencies.

XMPro iBOS refines maintenance schedules based on performance data, transitioning from reactive to predictive maintenance strategies. This approach aligns maintenance activities with actual needs, improving asset longevity and reducing downtime.

The suite generates automatic recommendations and alerts for city operations, driven by real-time and forecasted data analysis. This proactive monitoring ensures that all city systems, from streetlights to transit networks, operate at optimal efficiency.

XMPro iBOS’s interactive dashboards offer tailored insights into the operational health of a smart city’s ecosystem. These dashboards enable detailed scrutiny of specific areas, facilitating informed decision-making and centralized governance.

Designed with a modular approach, XMPro iBOS provides the flexibility required for smart cities to adapt and scale their operations in line with growth and evolving challenges.

The platform improves safety and operational efficiency by identifying and mitigating potential risks in real-time, ensuring public services operate within the parameters of safety and excellence.

XMPro Blueprints accelerate the deployment of smart city solutions, utilizing best practices for immediate operational improvements. This swift implementation empowers cities to rapidly benefit from digital transformation initiatives.
XMPro iBOS is adeptly designed to address the dynamic challenges of Smart City Performance Management. It offers a holistic, predictive, and integrated suite of tools that elevate operational efficiency, service quality, and citizen satisfaction across all city domains.
"*" indicates required fields